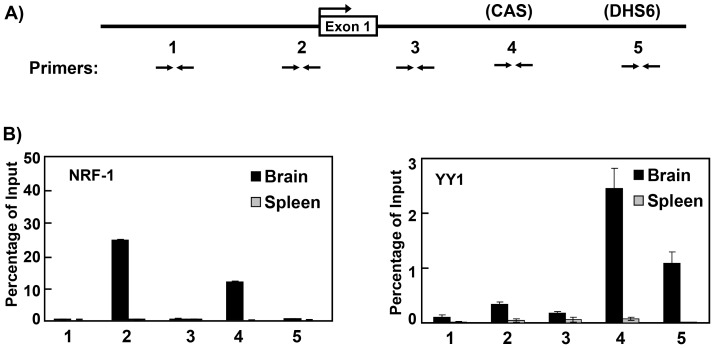
Figure 3. ChIP analysis of transcription factor binding to the Snrpn locus.
Chromatin immunoprecipitation analysis was performed to assay for binding of NRF-1 and YY1 to DH sites in the Snrpn 5′ region in primary brain and spleen cells of C57Bl/6 mice. A) Diagram of the mouse Snrpn 5′ region showing the regions assayed by ChIP. Pairs of opposing horizontal arrows depict the location of PCR primer sets used for real-time PCR in ChIP assays. Primer sets 1 and 3 are negative controls and amplify regions where no known factors are thought to be bound. B) Results of ChIP assays performed with antibodies against the transcription factors NRF-1 and YY1. Black and gray vertical bars denote the results for the ChIP experiments on brain cells and spleen cells of C57B/6 mice, respectively. Numbers under the graphs indicate the results obtained for the corresponding PCR primer sets shown in panel A.

