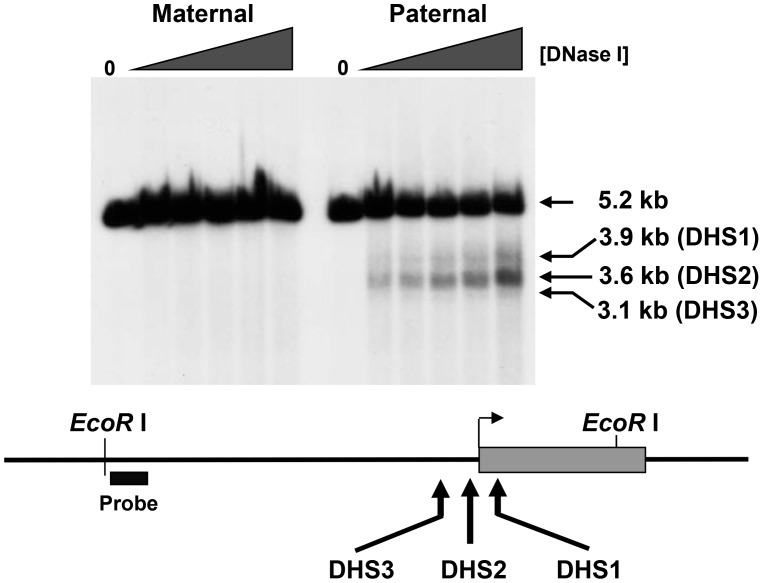
Figure 4. Mapping of DNase I hypersensitive sites in the Mkrn3 locus.
Intact cells were treated with increasing concentrations of DNase I and purified genomic DNA was analyzed by indirect end-labeling by Southern blotting as described in Materials and Methods. Maternal and paternal alleles were analyzed separately using TgPWSdel (PWS) and TgASdel (AS) fibroblasts. Lanes marked “0” represent samples of purified mouse genomic DNA from TgPWSdel or TgASdel cells. “Probe” indicates location of hybridization probe used in Southern blot analysis.

