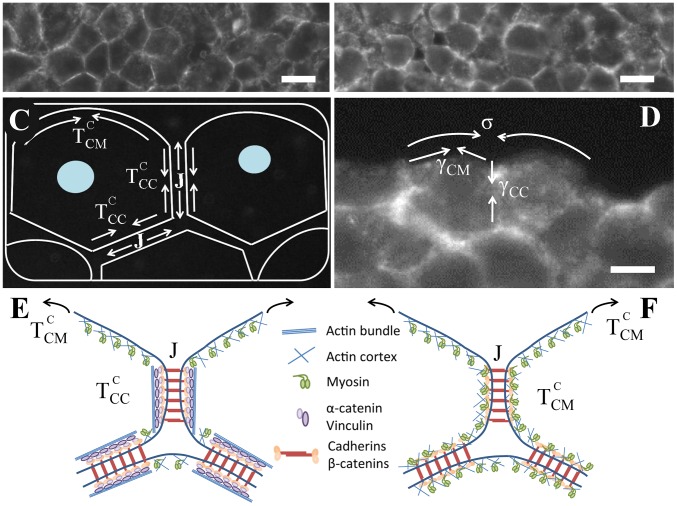
Figure 1. F9 versus F9 .
.
Cross sections of a F9 WT aggregate (A) and of a F9 aggregate (B). The staining is for
  -catenin, scale bars, 10
  . (C) Schematic representation of the cortical contractions at the cell-extracellular medium interface (
 ), at the cell-cell interface (
 ) and of the adhesion energy J.
  and
and  increase the tissue surface tension, whereas
  decreases it (see Eq. 2). (D) Closer view of two F9
 cells in contact. The difference between the interfacial tensions at the cell-cell
  and cell-extracellular medium
  interfaces gives the aggregate surface tension (
 ).
).  increases the surface tension whereas
  decreases it. Scale bar, 5
  . (E-F) Cartoons of cell-cell contacts in the case of F9 WT cells (E) and F9
 cells (F). The presence of
  -catenin at cell-cell junction is described as a catalyzer for actin reorganization at cell-cell junctions.

