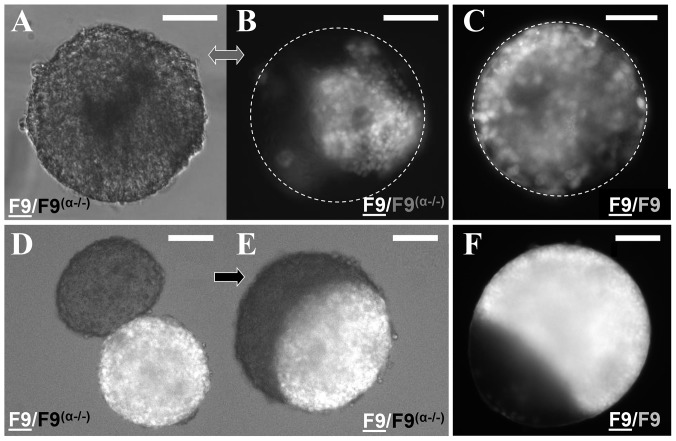
Figure 3. Contractility dependent TST still predicts sorting out and envelopment.
Phase contrast and fluorescence images representing configurations at different stages of the sorting out (A–C) and envelopment (D–F) processes. (A–B) Phase contrast and fluorescence images correspond to 72 hours after mixing F9 and F9 dissociated cells in hanging drops. (C) Control fluorescence of a F9/F9 mixture after 72 hours. (D–E) Engulfment of a F9/F9
 pair of aggregates 3 hours (D) and 29 hours (E) after the aggregates were brought in contact and allowed to fuse. (F) Final configuration (72 hours) of a F9/F9 pair of aggregates (control). Left right thick double arrow indicates simultaneous recording in phase and fluorescence. Rightwards thick arrow indicates evolution with time. Scale bars, 100
 m.
m.

