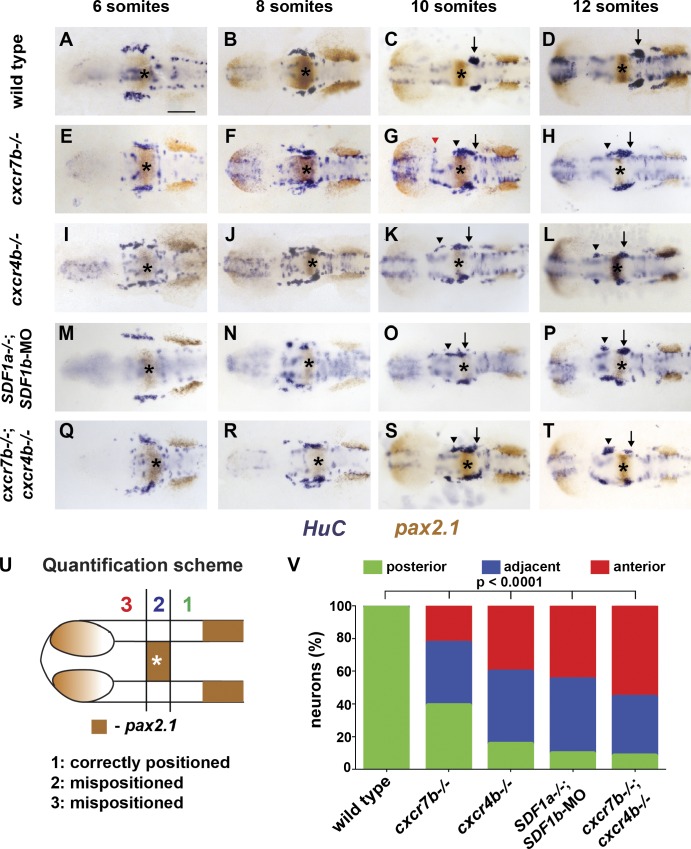
Figure 5.
TgSN migration is disrupted in embryos deficient in chemokine signaling. 6-, 8-, 10-, and 12-somite-stage embryos in A–T were stained with HuC (blue) and pax2.1 (brown) mRNA. MHB is marked with asterisks. Arrows and arrowheads denote correctly and incorrectly positioned TgSNs, respectively. The red arrowhead in G denotes mispositioned neurons located close to the eye. Dorsal view, anterior to the left. Bar, 100 µm. (A–D) Wild-type embryos. (E–H) cxcr7b−/− embryos. (I–L) cxcr4b−/− embryos. (M–P) SDF1a−/− embryos injected with SDF1b morpholino. (Q–T) cxcr7b−/−; cxcr4b−/− embryos. (U) Quantification of cell migration defects at the 12-somite stage. Zone 1 represents correctly positioned neurons located posterior to the MHB. Zones 2 and 3 represent mispositioned neurons located adjacent or anterior to the MHB, respectively. This approach was also used for quantification of neuron migration defects in Figs. 3, 6, 7, and 8. (V) Summary of the neuron positioning defects. The y axis corresponds to the percentage of neurons per embryo that are located in each zone. n ≥ 20 embryos for each genotype. Contingency table analysis using the χ2 test was applied to determine statistical significance. See also Table 2 and Figs. S3 and S4.

