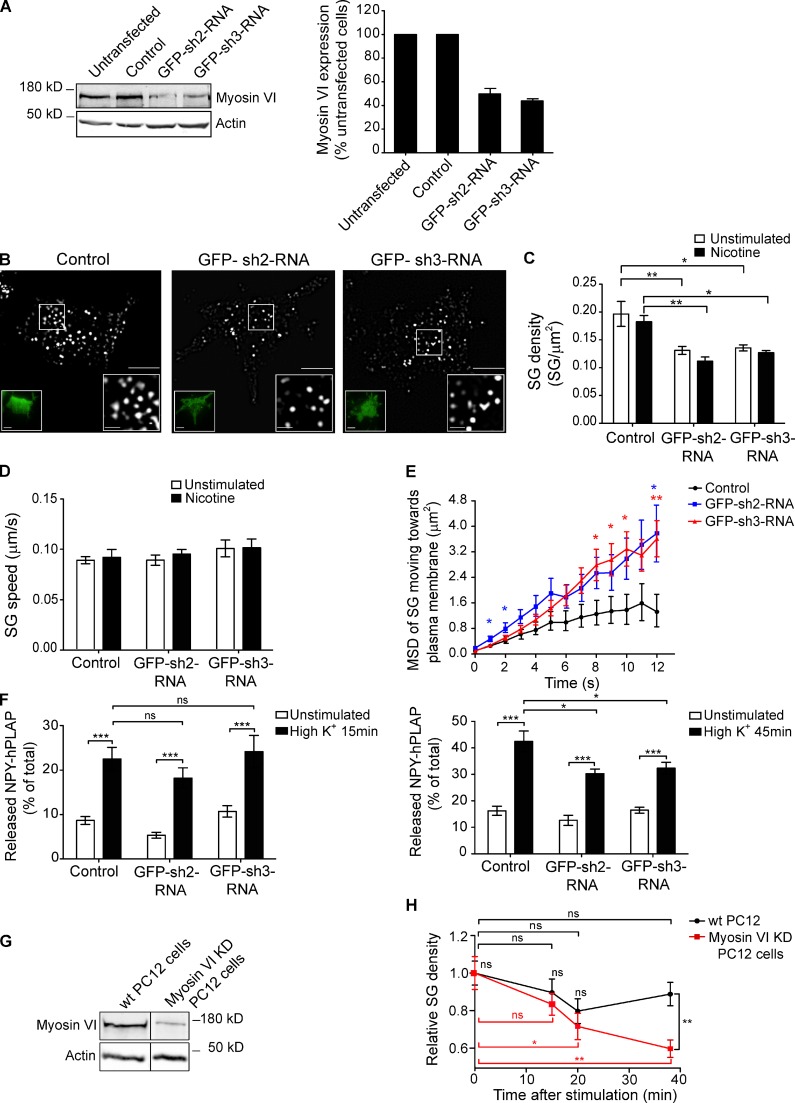
Figure 2.
Myosin VI knockdown impairs the maintenance of exocytosis. (A, left) Analysis of myosin VI expression levels by Western blotting with an anti–myosin VI antibody in untransfected PC12 cells, cells transfected with GFP-scrambled shRNA (control), and cells transfected with GFP-shRNA against myosin VI (GFP–sh2-RNA and GFP–sh3-RNA). Anti–β-actin was used as a loading control. (right) Quantification of the expression level of myosin VI (n = 6). (B) TIRF images of NPY-mCherry (pseudocolored gray) in PC12 cotransfected with GFP–scrambled-shRNA (control), GFP–sh2-RNA, or GFP–sh3-RNA. Left insets show the respective GFP-shRNA expression. The enlarged images on the right highlight a fixed area for comparison of SG density. Bars: (main images and left insets) 5 µm; (right insets) 1 µm. (C and D) SG density (C) and SG average speed (D) in the TIRF plane quantified in the condition shown in B before and after 100 µM nicotine stimulation. (E) Average MSD of tracked NPY-mCherry–positive SG appearing in the TIRF plane and moving toward the plasma membrane in the conditions shown in B, after nicotine stimulation, over 12 s of tracking. (F) NPY-hPLAP release was measured as described in Materials and methods using a double-stimulation protocol in control PC12 and cells expressing GFP–sh2-RNA or GFP–sh3-RNA. Released NPY-hPLAP is expressed as a percentage of total (n = 3 independent experiments). (G) Western blot using the anti–myosin VI antibody in wild-type (wt) or myosin VI stable knockdown (myosin VI KD) PC12 cells. A black line between the two lanes indicates the removal of intervening lanes from the original image for presentation purposes. (H) Wild-type or myosin VI knockdown PC12 cells expressing NPY-mCherry were imaged by TIRF microscopy for 40 min after a single high K+ stimulation. 40 frames per time point were analyzed, and the average SG density was quantified. SG density is expressed relative to the density values before stimulation. Error bars are means ± SEM. *, P < 0.05; **, P < 0.01; ***, P < 0.001.

