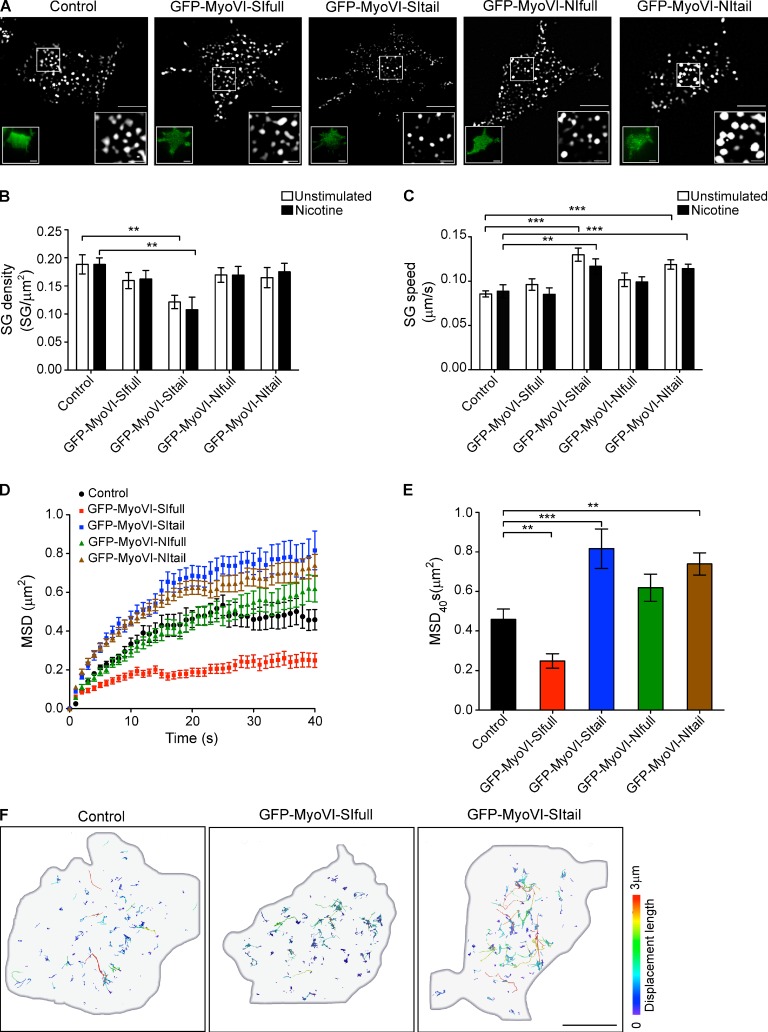
Figure 5.
Myosin VI SI regulates SG density and mobility in the cortical region. (A) TIRF images of NPY-mCherry (pseudocolored gray) coexpressed with GFP (control) or with the different GFP-MyoVI proteins in PC12 cells. Left insets show GFP or the respective GFP-MyoVI expression. The enlarged images on the right highlight a fixed area for comparison of SG density at the plasma membrane. (B and C) SG density (B) and SG speed (C) in the TIRF plane were quantified in the conditions described in A before and after 100 µM nicotine stimulation. (D and E) MSD versus time (D) and average values (E) after 40 s of tracking of NPY-mCherry–positive SGs shown in A. (F) PC12 cells coexpressing NPY-mCherry with GFP (control), GFP-MyoVI-SIfull, or GFP-MyoVI-SItail were imaged by TIRF microscopy. NPY-mCherry–positive SGs were tracked, and their lateral movement and displacement length were analyzed. Track displacement length is displayed as a color code. Note the high proportion of short trajectories when the GFP-MyoVI-SIfull was expressed and the very long tracks were detected upon expression of GFP-MyoVI-SItail. Bars: (A [main images and left insets] and F) 5 µm; (A [right insets]) 1 µm. Error bars are means ± SEM. **, P < 0.01; ***, P < 0.001.

