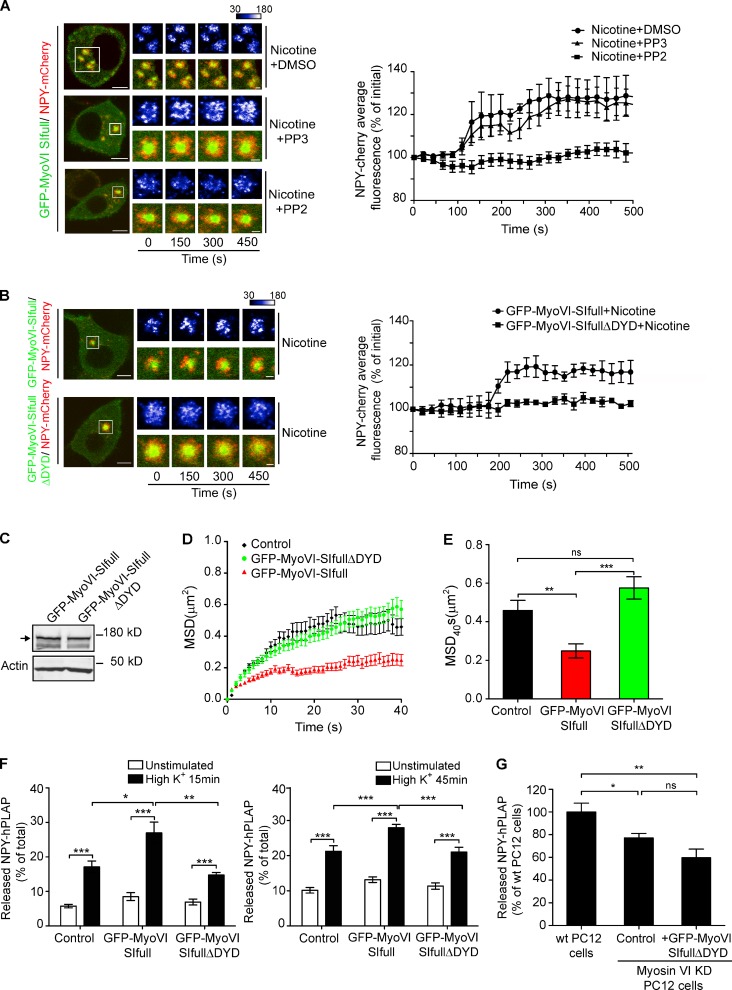
Figure 8.
The function of myosin VI SI in neuroexocytosis is regulated by c-Src kinase phosphorylation. (A, left) PC12 cells coexpressing GFP-MyoVI-SIfull and NPY-mCherry pretreated with DMSO, PP3, or PP2 for 40 min at 37°C and imaged after 100 µM nicotine stimulation in the presence of DMSO (nicotine + DMSO), PP3 (nicotine + PP3), or PP2 (nicotine + PP2). (right) Quantification of NPY-mCherry fluorescence around GFP-MyoVI–positive structures in the conditions shown in the left images. The NPY-mCherry images are shown as pseudocolor images. (B, left) PC12 cells coexpressing NPY-mCherry with GFP-MyoVI-SIfull or GFP-MyoVI-SIfullΔDYD after 100 µM nicotine (nicotine) stimulation. (right) Quantification of NPY-mCherry fluorescence around GFP-MyoVI–positive structures under conditions described on the left. (C) GFP-MyoVI-SIfull and GFP-MyoVI-SIfullΔDYD expression in PC12 cells were evaluated by Western blotting using the anti–myosin VI antibody. The arrow indicates the GFP-MyoVI proteins (175 kD). (D) PC12 cells coexpressing NPY-mCherry with GFP (control), GFP-MyoVI-SIfull, or GFP-MyoVI-SIfullΔDYD were imaged by TIRF microscopy. NPY-mCherry–positive SGs were tracked after stimulation, and the average MSD during the first 40 s was plotted. (E) Average MSD at 40 s of tracking of NPY-mCherry–positive SGs. The results for control and GFP-MyoVI-SIfull–expressing cells are the same as those shown in Fig. 5 (D and E). (F) NPY-hPLAP release was evaluated using a double-stimulation protocol in PC12 cells expressing GFP (control), GFP-MyoVI-SIfull, or GFP-MyoVI-SIfullΔDYD. Released NPY-hPLAP is expressed as a percentage of total NPY-hPLAP (n = 3). The results for control and GFP-MyoVI-SIfull–expressing cells are the same as those shown in Fig. 3 D. (G) NPY-hPLAP release was measured in wild-type (wt) PC12 cells and myosin VI stable knockdown (KD) PC12 cells expressing GFP (control) or GFP-MyoVI-SIfullΔDYD (+GFP-MyoVI-SIfullΔDYD). Released NPY-hPLAP is expressed as a percentage of rescue compared with wild-type PC12 cells (n = 3). Bars: (A and B, left) 5 µm; (A and B, right) 1 µm. Error bars are means ± SEM. *, P < 0.05; **, P < 0.01; ***, P < 0.001.

