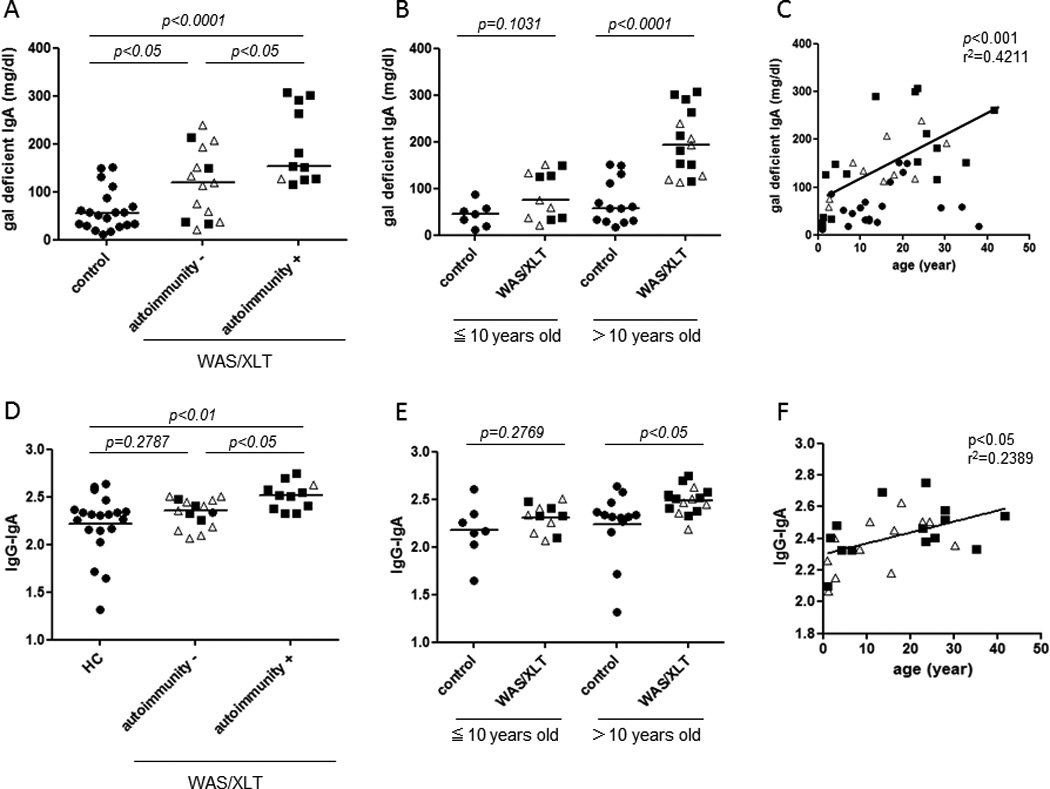
Figure 1. Increased serum galactose-deficient IgA levels and CIC containing IgA and IgG in WAS/XLT.

The bars represent the median values. Open triangles, XLT; filled squares, WAS.
A. Serum levels of galactose-deficient IgA
B,C. Correlation between serum galactose-deficient IgA levels and age.
D. Serum levels of IgG-IgA CIC
E,F. The correlation between serum levels of IgG-IgA CIC and age.
