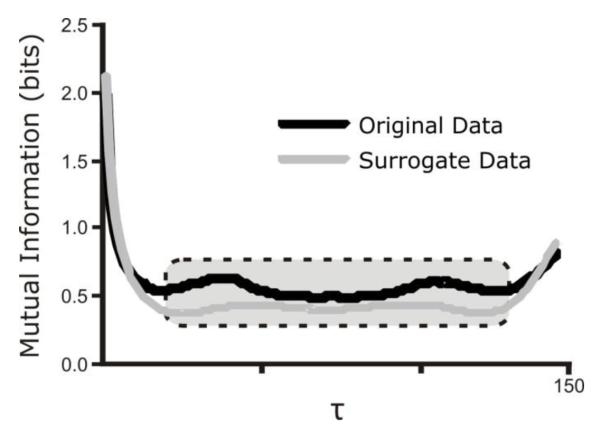
Figure 1.
Methodology of calculating average value of Mutual Information. The small and large τ values represent periods of high linear correlation and are thus outliers. The inner 65% of data points, represented by the dotted box superimposed on the graph, is averaged to determine the reported value of Mutual Information.

