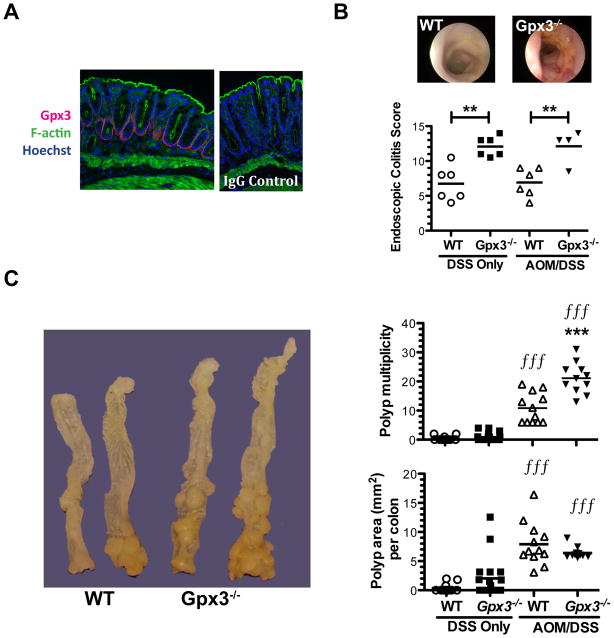
Figure 2. Gpx3 functions as a tumor suppressor in inflammatory carcinogenesis.
A) Immunofluorescence staining of normal WT colon. Gpx3 (red), F-actin (phalloidin, green), and Hoescht (blue) staining is shown (left). IgG control is shown on the right (60x magnification). B) Representative colonoscopic images from WT (top left) or Gpx3−/− (top right) mice after 3 cycles of DSS, and murine endoscopic colitis scoring utilizing the murine endoscopic index of colitis severity (MEICS). **P<0.01. C) Representative gross specimens from the indicated genotype (left). Tumor multiplicity (top right) and polyp burden (bottom right) are shown, results were determined via calculation of the combined surface area (Σitot SAi=Li x Wi) of all lesions in each colon. DSS only WT, N=13; Gpx3−/−, N=18, AOM/DSS WT, N=12; Gpx3−/−, N=11. *** P<0.001 between WT and Gpx3−/−. fff P<0.001 DSS only vs. AOM/DSS groups.

