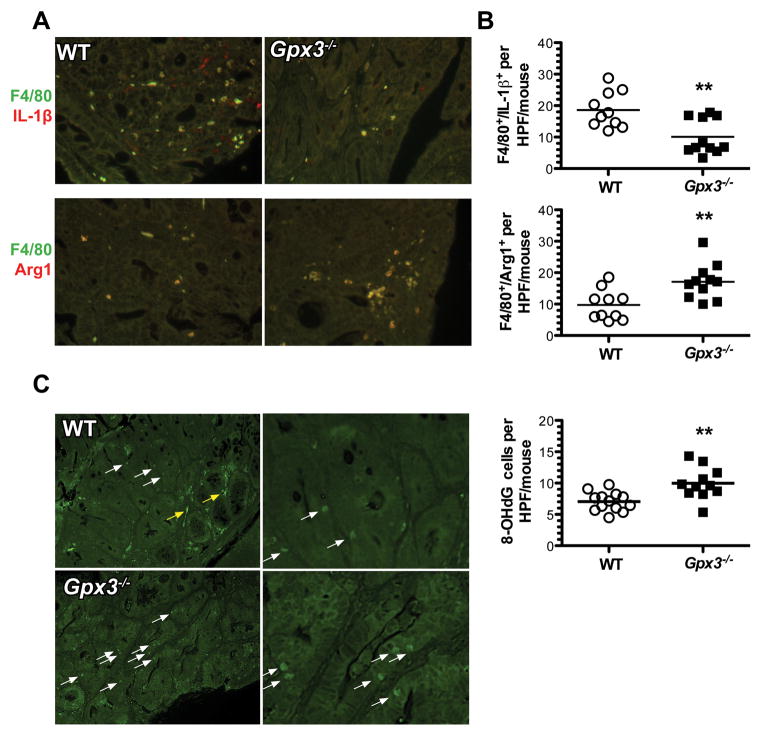
Figure 5. Increased M2 macrophages and evidence for oxidative DNA damage in Gpx3−/− tumors.
Immunofluorescence for M1 (IL-1β+, F4/80+) and M2 (Arg1+, F4/80+) macrophage markers and 8-OHdG was performed according to Methods. A) Example images from WT top row or Gpx3−/− tumors. B) Quantification of M1 (top) or M2 (bottom) macrophages per tumor high-powered field (HPF). **P<0.01. C) Example images from WT (top row) or Gpx3−/− (bottom row) tumors. White arrow indicates positive staining in epithelial cells, yellow arrow indicates non-specific staining. D) 8- OHdG quantification. ** P<0.01. All images taken at 40x magnification.

