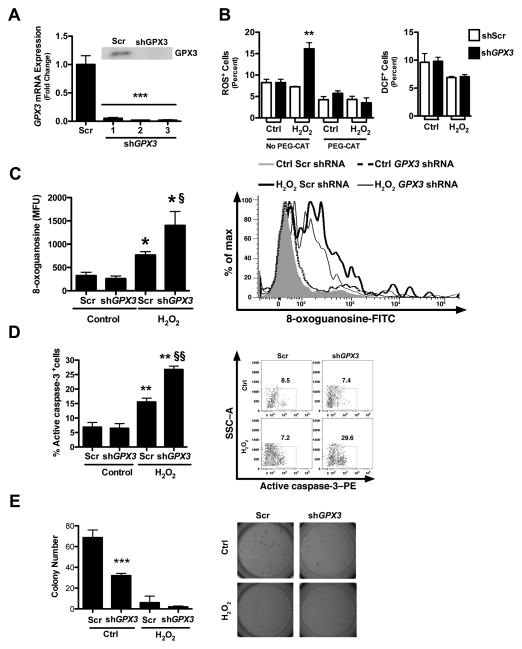
Figure 6. Increased ROS, DNA damage, and apoptosis and decreased soft agar colony formation post-GPX3 knockdown.
A) GPX3 mRNA and protein (insert) expression after knockdown with GPX3-specific shRNA constructs in Caco2 cells. **P<0.01. B) Quantification of percentage of ROS positive cells (DCFH2+) post-GPX3 knockdown in untreated or 200 μM H2O2 treated Caco2 cells after pre-treatment with the H2O2 scavenger PEG-CAT (left). **P<0.01. Quantification of percentage of DCF+ (oxidation-insensitive analog) cells post-Gpx3 knockdown in untreated or H2O2 treated Caco2 cells (right). C) DNA damage as measured by 8-oxoguanosine-FITC flow cytometry in cells treated with scrambled or Gpx3-specific shRNAs and with or without H2O2 treatment. *P<0.05, fP<0.05, D) Apoptosis, assessed as staining for active caspase-3 by flow cytometry. The percent positive cells are shown. ** P<0.01, ffP<0.01. E) Colony formation assay in Matrigel in Gpx3 knockdown and scrambled control Caco2 cells with and without H2O2 treatment. ***P<0.001 Scr vs shGPX3 control.

