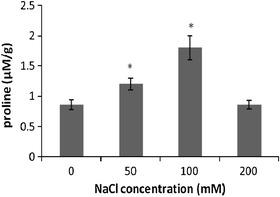
Fig. 2.

The change of proline contents induced by NaCl treatment in the callus of S. persica. Data represent the mean ± SE (n = 3). *Significant differences between the control and treated callus (P < 0.05)

The change of proline contents induced by NaCl treatment in the callus of S. persica. Data represent the mean ± SE (n = 3). *Significant differences between the control and treated callus (P < 0.05)