
Figure 1.
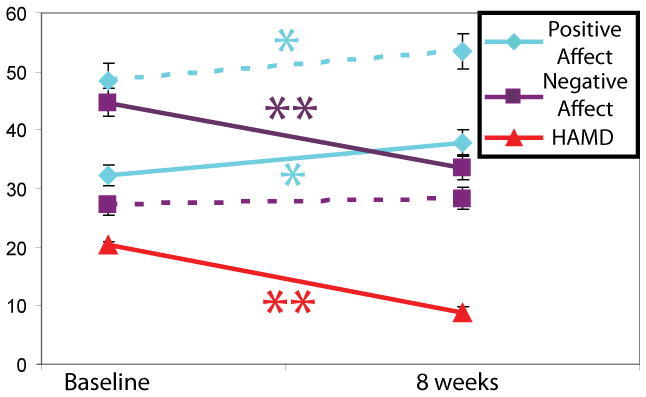
Changes in HAMD, self-reported positive affect and negative affect from 0 – 2 months. * = p < .01; ** = p < .001. Solid lines: depressed patients, hatched lines, healthy controls. Note that HAMD for controls was not shown because mean HAMD for controls was 1.07 and 1.64 for baseline and 8 week assessment, respectively.