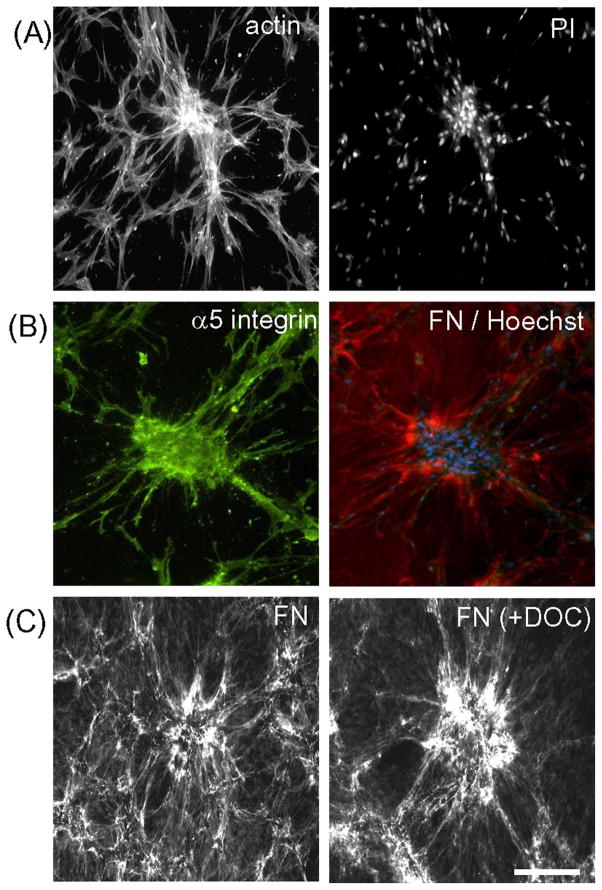
Figure 2. Structural organization and molecular composition of cell clusters.
(A) Fluorescence microscopy image of a fibroblast cluster formed during 18h in DMEM/FBS fixed and stained for actin and nuclei (PI). (B) Same as “A” except stained for α5 integrin (green), FN (red), and cell nuclei (Hoechst, blue). (C) Same as “A” except washed once with cold PBS, and treated for 10 min at 37°C in PBS without or with 1% deoxycholate (DOC) as indicated after which the samples were washed three times and fixed and stained for fibronectin. Bar = 100 μm.

