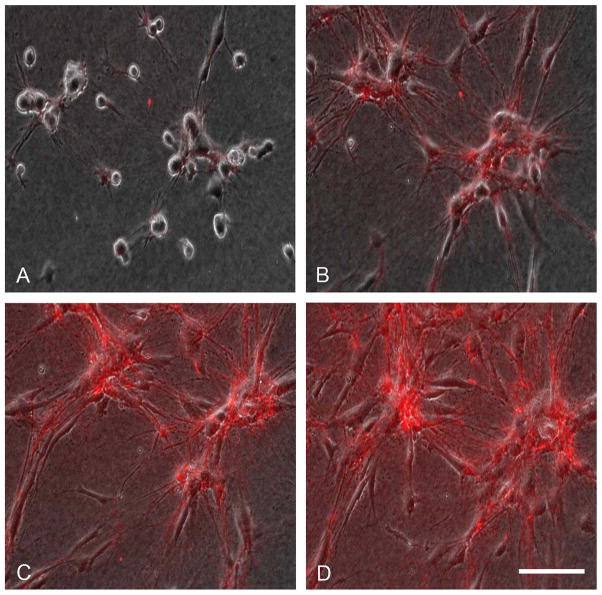
Figure 3. Rhodamine-fibronectin organization during cell cluster formation.
Time-lapse phase contrast/fluorescence images (from Supplemental Movie 2) of cells cultured 18h on collagen matrices in DMEM/FBS containing 5 μg/ml rhodamine-FN. Images shown are from the same microscopic field at the times indicated. (A) 1 h; (B) 4h; (D) 8h; (D) 18 h. Bar = 100 μm.

