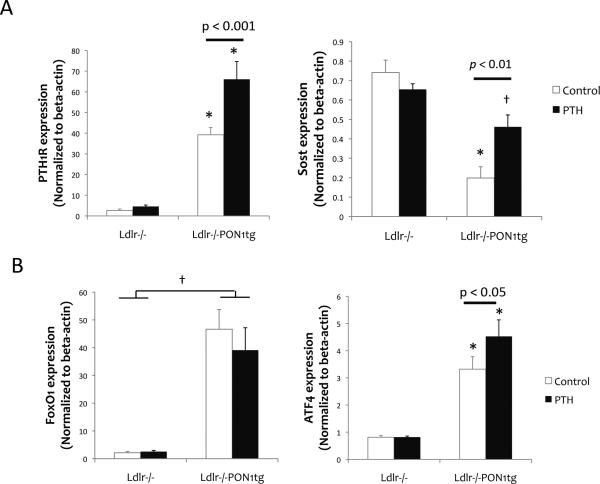
Figure 2. Effects on osteocytic gene expression.
Realtime RT-qPCR analysis of RNA isolated from femoral cortical bone, devoid of bone marrow, for (A) PTH1R and Sost, (B) FoxO1, and ATF4 expression. Values were expressed as mean ± SEM. *p < 0.001 vs. Ldlr-/- (both control and PTH); †p < 0.001 vs. Ldlr-/- (both control and PTH).

