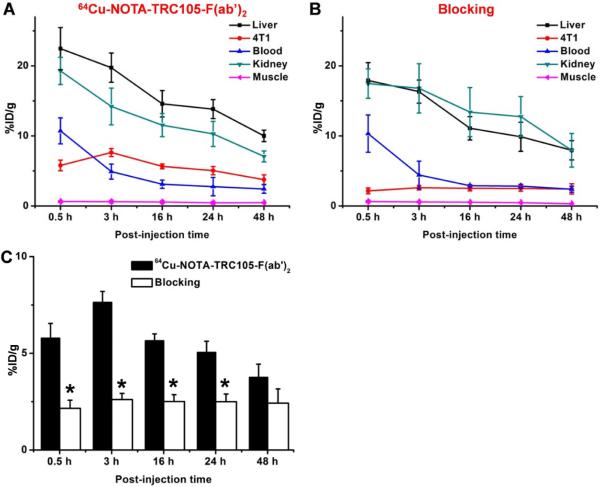
Figure 4.
Quantitative analysis of the PET data. (A) Time-activity curves of the liver, 4T1 tumor, blood, kidney, and muscle upon intravenous injection of 64Cu-NOTA-TRC105-F(ab')2. (B) Time-activity curves of the liver, 4T1 tumor, blood, kidney, and muscle upon intravenous injection of 64Cu-NOTA-TRC105-F(ab')2, after a blocking dose of TRC105. (C) Comparison of tracer uptake in the 4T1 tumors between the two groups. n = 4; *, P < 0.05.

