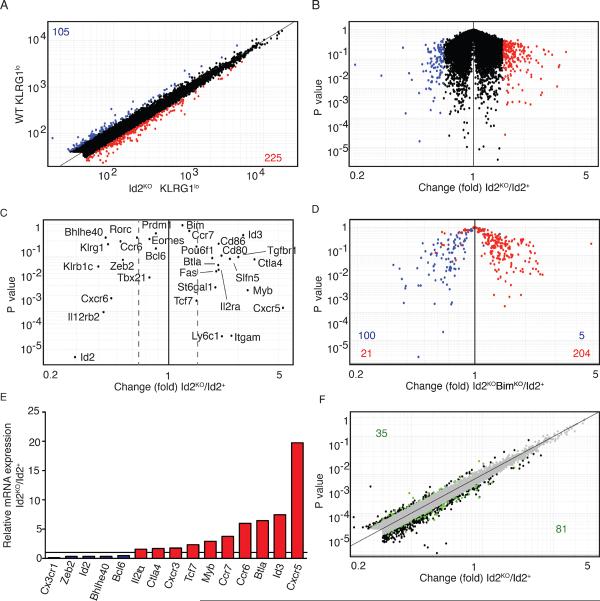
Figure 6. Gene-expression profile of Id2+ versus Id2KO KLRG1lo cells during infection.
Gene expression analysis of WT versus Id2KO effector cells. CD45.1.2+ mice received CD45.1 OT-I WT (4 × 10⁴) cells mixed with CD45.2 OT-I BimKO, Id2KO or Id2KOBimKO (4 × 10⁴) cells 1 day before infection with Lm-OVA. KLRG1hi and KLRG1lo cells were sorted on day 6. (A) Fold change plot of WT KLRG1lo versus Id2KO KLRG1lo CD8+ T cells. Numbers in corners indicate genes with a difference in expression of 1.7-fold or more. Genes upregulated in Id2KO KLRG1lo cells are indicated in red, genes downregulated are indicated in blue. Data are pooled from 3 independent experiments. (B) `Volcano' plot of expression data in (A). (C) Gene expression of key genes in WT KLRG1lo versus Id2KO KLRG1lo CD8+ T cells. Dotted lines indicate 1.5-fold difference. (D) Gene expression of genes 1.7 fold up- or downregulated in WT KLRG1lo versus Id2KOBimKO KLRG1lo CD8+ T cells plotted for wild-type versus Id2-knockout cells. Genes upregulated in Id2KOBimKO KLRG1lo CD8+ T cells are indicated in red, genes downregulated are indicated in blue. (E) mRNA expression of relevant genes in Id2KO compared to Id2+ KLRG1lo cells on day 6 of Lm-OVA infection. (F) Gene expression in WT KLRG1lo versus Id2KO KLRG1lo CD8+ T cells; green indicates E2A occupancy. Numbers in corners indicate number of genes with E2A occupancy.
Knell et al.

