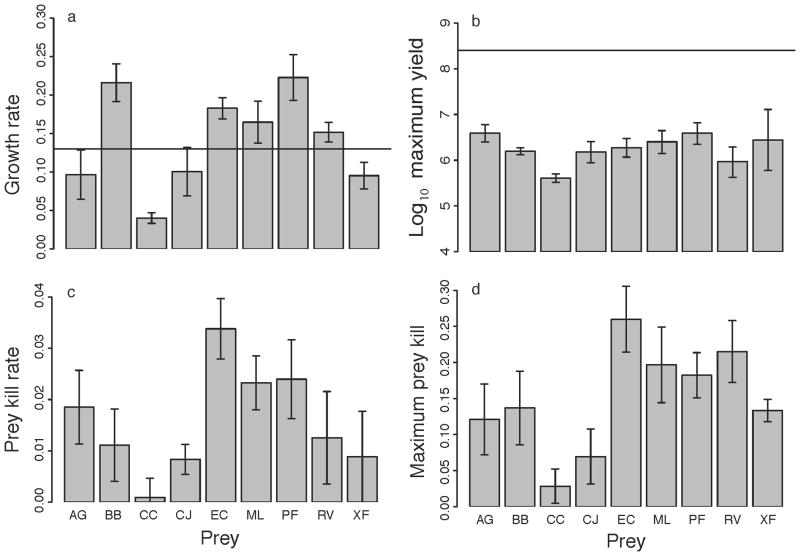
Figure 3.
Predator growth rate (a), maximum predator yield (b), prey kill rate (c) and maximum prey kill (d) for M. xanthus growth on nine prey species in the absence of swarm expansion. The solid lines in panels a and b represent the average value of each respective parameter measured on nutrient-rich CTT agar. The dashed line in panel b represents the average maximum yield on starvation agar. Error bars represent the standard error of the mean.

