
FIGURE 6. Thymic maturation of Treg subpopulations in the presence and absence of IL-2R signaling.
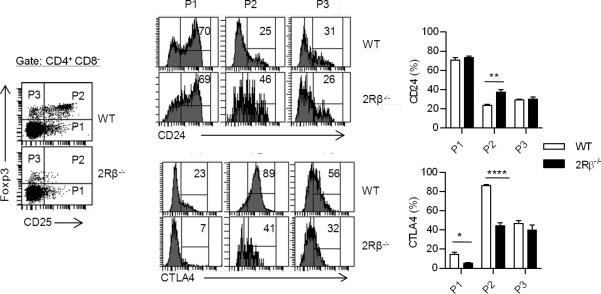
Representative dot plots (left) for the indicated thymic populations from WT and 2Rβ-/- mice and histograms (middle) for CD24 and CTLA4 expression by the cells within the indicated gated regions of the dot plots. The percent of cells within the P1-3 gates for CD24 and CTLA4 are shown to the right. Data are means ± SD from 4-5 mice/group.