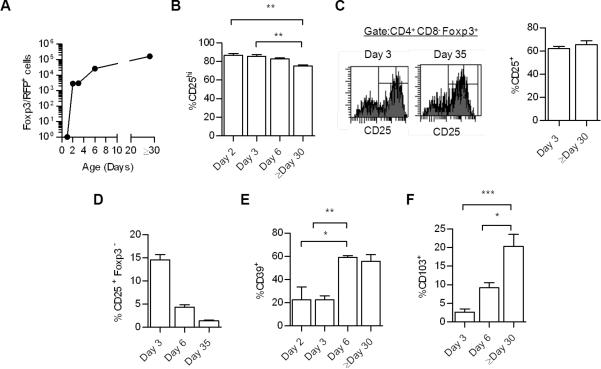
FIGURE 7. Treg developmental progression and maturation in the neonatal thymus of WT mice.
In each panel, thymocytes were always first gated on CD4+ CD8- thymocytes. The number (A) and expression of CD25 (B) by Foxp3+ cells from Foxp3/RFP reporter mice of the indicated age. Data are means ± SD from 4-6 mice/group, except day 1 (n=2). (C) Comparison of CD25 expression by Foxp3+ T cells from mice of the indicated age after intracellular staining for Foxp3 protein. (D) Representation of the CD4+ CD25- Foxp3- population from Foxp3/RFP reporter mice of the indicated age. (E-F) Expression of CD39 and CD103 by Foxp3+ cells from Foxp3/RFP reporter mice of the indicated age. Data (C-F) are means ± SD from 3-6 mice/group.

