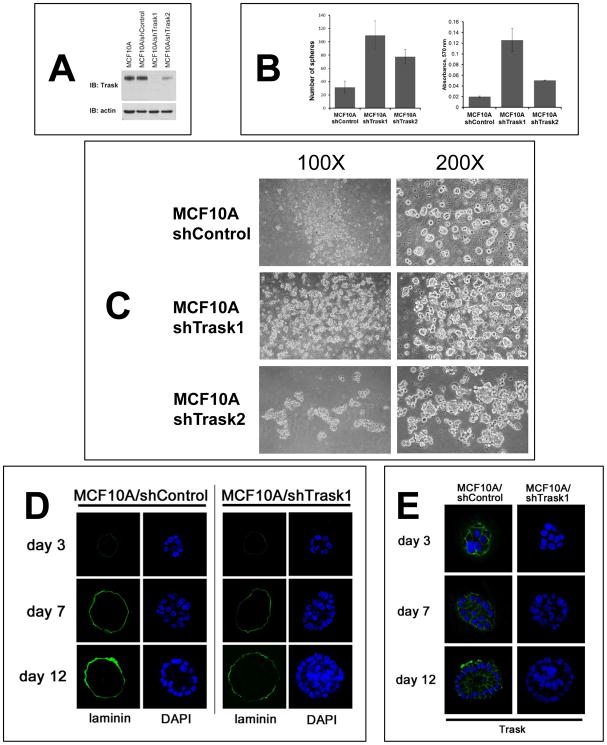
Figure 7. Anchorage-independent growth in the presence or absence of Trask.
(A) MCF10A cells were engineered to stably express either of two Trask-targeting shRNAs or a non-silencing shRNA and the loss of Trask expression in these cells was confirmed by immunoblotting. MCF10A/shTrask1 cells have a complete loss of Trask while MCF10A/shTrask2 cells have a partial loss of Trask expression. (B) The indicated cell types were cultured in non-adherent plates for 6 days and the number of spheroids counted manually by microscopic examination in triplicate wells (left). The total number of cells in each well was also compared using the MTT assay (right). (C) The appearance of the spheroids was captured by phase contrast microscopy at the indicated magnifications for the three cell types. (D) MCF10A/shControl and MCF10A/shTrask1 cells were grown on matrigel for the indicated number of days and the cellular architecture, density, and expression of laminin were determined by immunofluorescence staining and confocal microscopy. Laminin was stained using green-fluorescent reagents and DAPI staining was used to stain the cell nuclei. (E) Additional sections were stained with anti-Trask antibodies in green as shown.

