
Figure 1.
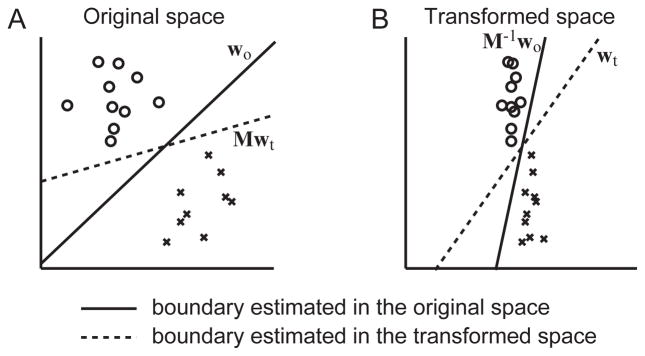
Schematic illustration for the effect of data transformation on boundary estimation of the linear SVM. A binary classification example for two-dimensional data with 20 samples (10 for each class) is shown in the original space (A) and in the transformed space (B). The solid line represents the boundary estimated in the original space and the dotted line represents the boundary estimated in the transformed space.