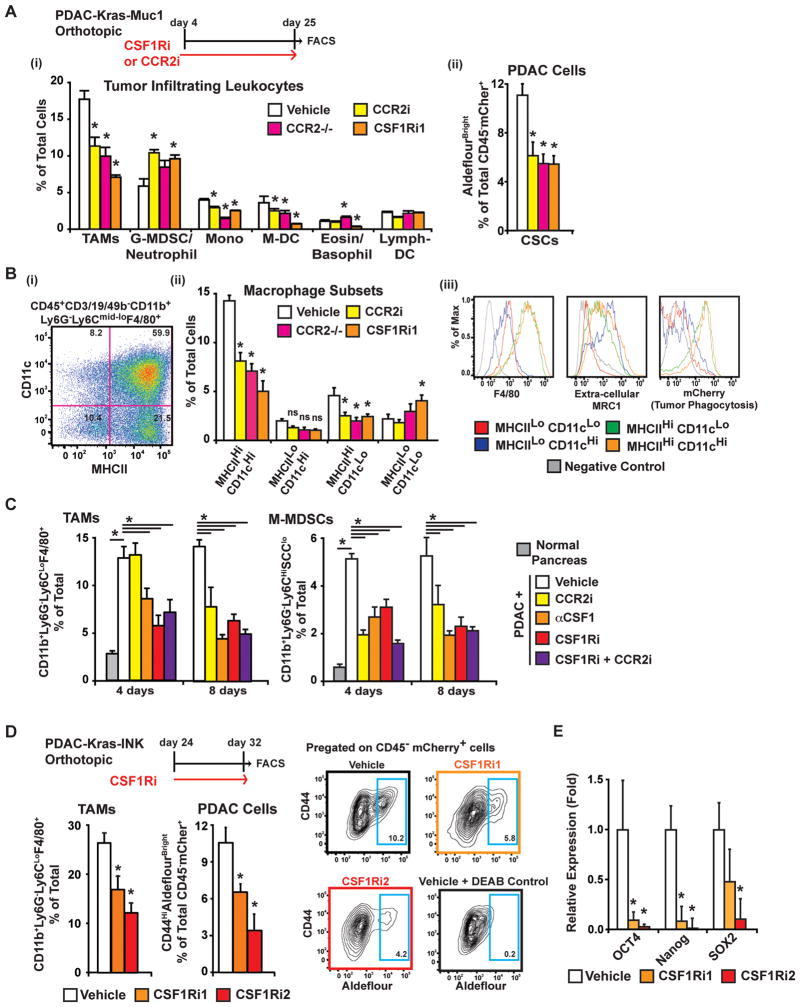
Figure 2. Depletion of TAMs results in reduced ALDHBright TICs.
A) Analysis of leukocyte and ALDHBright TIC frequency in KCM tumors from mice treated for 21 days with vehicle, CSF1Ri1, CCR2i or in CCR2−/− hosts. (i) The presence of CD11b+Ly6G− Ly6CLoF4/80HiMHCII+ macrophage, CD11b+Ly6GHiLy6C+ (G-MDSC/neutrophil), CD11b+Ly6G− Ly6CHiF4/80+MHCII+SSCLo monocyte (mono), CD11b+Ly6G− Ly6CLoCD11cHiMHCIIHi (M-DC), CD11b+Ly6G+Ly6C− MHCII+ (basophil), and CD11bLoLy6G−Ly6C− CD11cHiMHCIIHi (Lymph-DC) subsets is depicted as the mean % of total live cells. (ii) ALDHBright TICs are depicted as the mean % of total live CD45−mCherry+ cells.
B) Analysis of macrophage subsets following CCR2 or CSF1R inhibition. (i) CD11b+CD3/19/49b− Ly6G−Ly6CLoF4/80+ macrophages were subdivided by MHCII and CD11c expression, and (ii) the mean frequency of each subset is displayed for all treatment groups. (iii) Relative expression of F4/80, CD206, and mCherry (indicator of phagocytosis) is depicted.
C) Flow cytometry analysis of TAMs and M-MDSCs infiltrating PAN02 tumors in mice treated for 4 or 8 days with vehicle, anti-CSF1, CCR2i, and/or CSF1Ri2 is depicted.
D) The mean frequency of macrophages and CD45−mCherry+ALDHBright TICs in Kras-INK tumors following 8 days of CSF1Ri treatment is depicted. Representative flow cytometry plots of mCherry+ ALDHBright tumor cells (Blue gate) are shown.
E) Quantitative-RT-PCR analysis in orthotopic Kras-INK tumor tissue following treatment with CSF1Ri for 14 days. Graph depicts the mean fold change compared vehicle.
Flow cytometry and quantitative-RT-PCR data depict the mean values from 5–10 mice ± SEM. * denotes statistically significant differences at p<0.05 (Mann-Whitney U-test).

