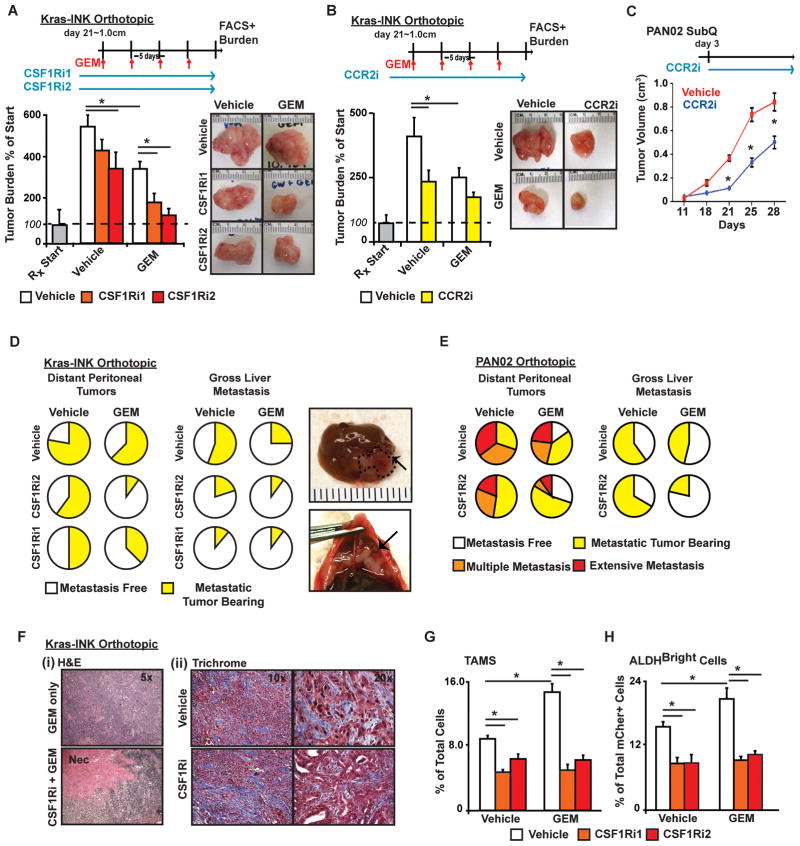
Figure 4. Inhibition of CSF1R or CCR2 overcomes chemoresistance.
A–B) Mice bearing established Kras-INK tumors were treated with vehicle or CSF1Ri1, CSF1Ri2, or CCR2i (B) ± GEM. The tumor burden was accessed by wet tumor weight, and it is displayed as the mean % increase compared to five mice sacrificed at the start of treatment (“RXStart”).
C) The growth of subcutaneous PAN02 tumors in mice treated with ± CCR2i is depicted (n=5/group).
D–E) The frequency and/or severity of disseminated tumors in the perennial cavity or liver is depicted as the proportion of mice with gross tumors at necropsy (n=10–15 mice/group).
F) (i) Images of hematoxylin and eosin staining depicts necrotic tissue (Nec) following CSF1Ri and GEM treatment, and (ii) TriChrome staining depicts collagen deposition (blue).
G–H) Flow cytometry analysis of TAM and ALDHBright TIC frequency in Kras-INK tumors is depict the mean % of the total number of live cells or CD45−mCherry+ cells (n=5–8 mice/group). * denotes p<0.05 (Mann-Whitney U-test or unpaired t-test) in all panels.

