
Figure 1. Chromatin state maps for in vivo tissues, stem cells and primary culture models.
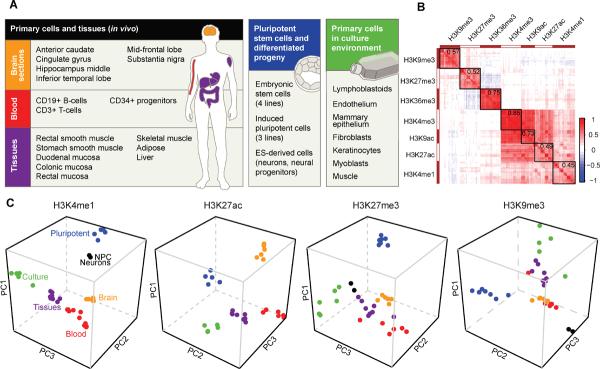
(A) Over 300 chromatin state maps were generated for human tissues, stem cells and cultured primary cells. In the schematic, tissues and cells with related phenotypes are grouped and color-coded. (B) Cross-correlation map generated by clustering ~200 histone modification profiles based on pair-wise correlations. Heat indicates degree of positive (red) or negative (blue) correlation between datasets. Mean correlation values over all datasets for each modification are indicated at the upper right of the corresponding block. (C) Projection plots show PCA coordinates for each tissue and cell type (colored as in `A'). The data indicate that coherent variations in the chromatin landscape distinguish cells from different developmental stages, lineages and growth environments. See also Figure S1 and Table S1