
Figure 4. Epigenetic states relate to context-specific genome regulatory programs.
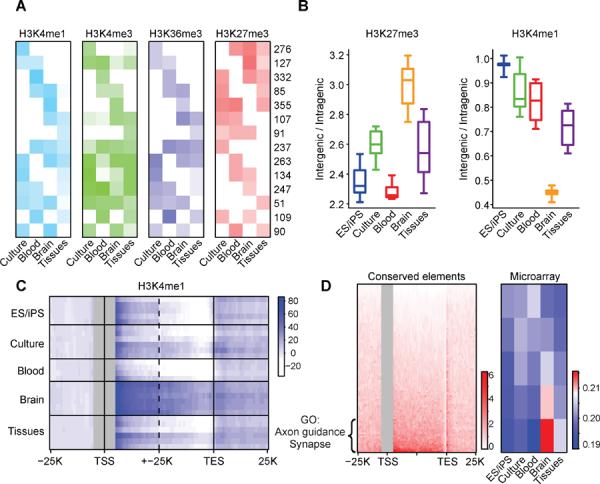
(A) Chromatin states are depicted for a set of 100 kb loci with variable activity patterns. Rows correspond to clusters of loci with similar cell type-specificities. Heatmap depicts relative levels of H3K4me1 over distal elements (light blue), H3K4me3 over promoters (green), H3K36me3 over gene bodies (dark blue), and overall H3K27me3 (red) for each cluster in the indicated phenotypic group. Numerical values indicate the number of loci in each cluster. Promoter, gene and distal element activities are largely concordant within a locus, but are exclusive with H3K27me3. (B) Boxplots show H3K27me3 coverage of intergenic regions relative to gene bodies (left), and H3K4me1 peak density in intergenic regions relative to gene bodies (right). Brain sections are notable for a high prevalence of repressive chromatin throughout intergenic regions and a relative confinement of H3K4me1 sites within genes. (C) Heatmap shows composite H3K4me1 profiles over genes and flanking regions (TSS ± 15 kb and TES ± 15 kb; all genes > 15 kb) for each cell type (rows). Brain sections display higher H3K4me1 signals in gene bodies, even when TSS proximal regions (± 5 kb) are masked (gray). (D) Heatmap (left panel) shows the distribution of highly-conserved non-coding sequence elements over gene bodies and flanking regions (TSS ± 25 kb and TES ± 25 kb) for all genes >15 kb (rows). The genes are ordered according to the density of conserved elements within their introns. The top quintile of genes (n=1760) is strongly enriched for functional annotations related to brain physiology, including axon guidance (p < 10−13) and synapse (p < 10−9), and exhibit higher RNA expression in brain (heatmap at right; red indicates high expression; blue indicates low expression). These data suggest that a highly restrictive chromatin structure in specialized brain cells favors access to intronic regions and may influence the function of sequence elements that mediate corresponding regulatory programs. See also Figure S3.