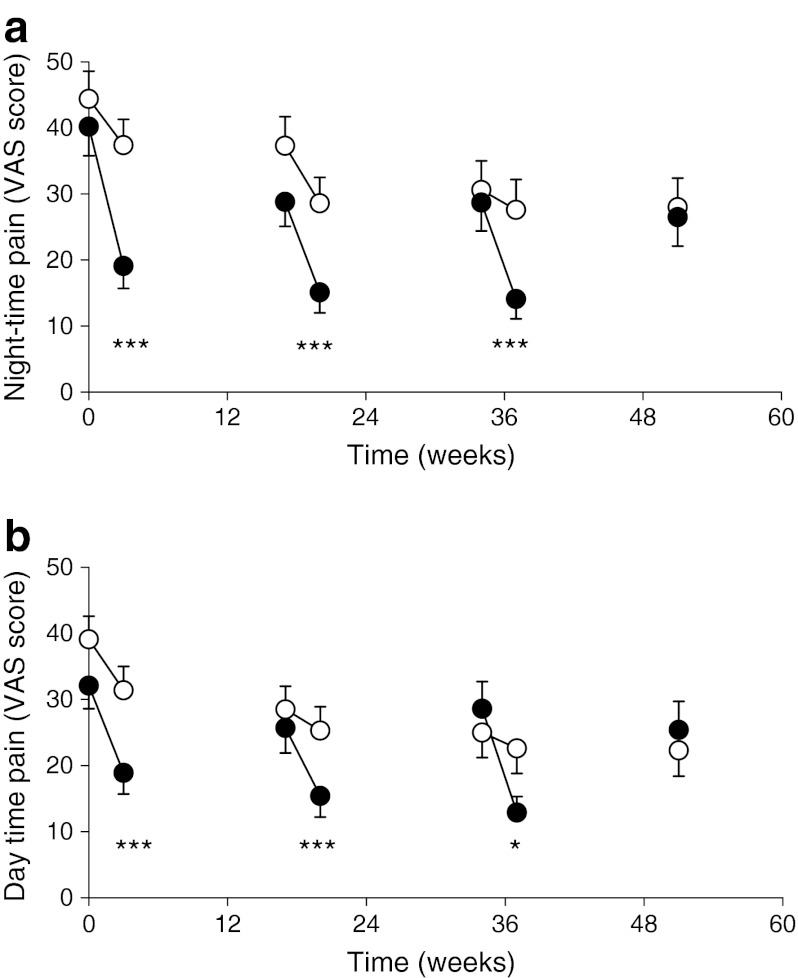
Fig. 2.
VAS score for night-time pain (a) and daytime pain (b) for study participants in the FREMS group (black circles) and in the placebo group (white circles) in the ITT population, before and after each treatment cycle and at the end of follow-up. Data are presented as means and SE. For each treatment cycle we compared the difference in the VAS score (end of treatment cycle – beginning of treatment cycle) between treatment groups: *p < 0.05, ***p < 0.001, FREMS vs placebo

