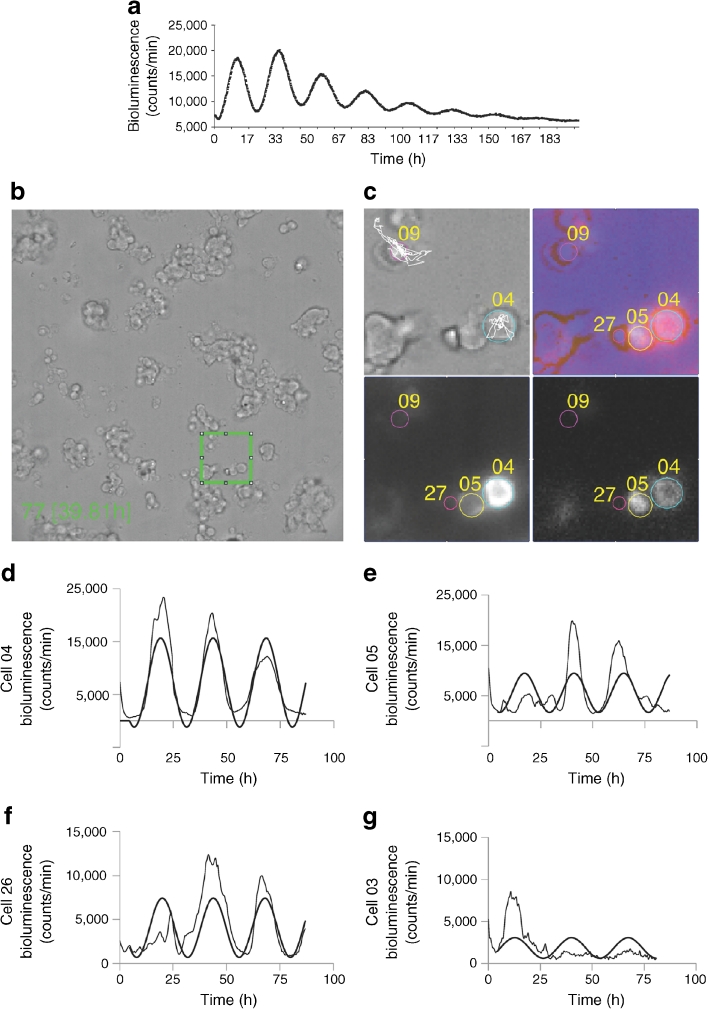
Fig. 4.
Beta and non-beta cells possess cell-autonomous clocks. (a) Oscillation profiles of dexamethasone-synchronised human islet cells transduced with Bmal1-luc encoding lentiviral particles. Bmal1-luc oscillation profiles were recorded for three parallel dishes for each of the five donors. (b) Representative full DIC image (512 × 512 pixels) of human islet cells attached to a Wilco glass bottom dish and subjected to time-lapse bioluminescence/fluorescence microscopy (ESM Video 2). (c) Four analysed cells, No. 04, No. 05, No. 09 and No. 27, overlaid on a zoomed 76 × 76 pixel patch (corresponding to the green square in [b], ESM Video 3). Light-grey panel, DIC image; dark-grey panel, image taken with the red fluorescence channel (RIP-tomato expression); black panel, image taken with the bioluminescence channel (Bmal1-luc expression); lilac panel, composite image of all three channels. Representative trajectories (cell No. 04 and No. 09) are overlaid in white over the DIC image. (d, e) Bioluminescence expression profiles of two representative beta cells, No. 04 and No. 05, with average tomato expression intensity of 14,720 and 8,735 pixels/cell, respectively (threshold for beta cells: 8,000 pixels/cell). The zone between 6,000 and 8,000 pixels/cell was considered ‘unclassified’. The raw data and the fitted sinusoid curve (bold curve) are shown in the profiles of both cells. (f, g) Bioluminescence expression profiles of cell No. 26 and No. 03 (ESM Video 2). Both cells are considered to be non-beta cells with average tomato intensity below 6,000 pixels/cell. The raw data and the fitted sinusoid curve (bold curve) are shown in the profiles of both cells

