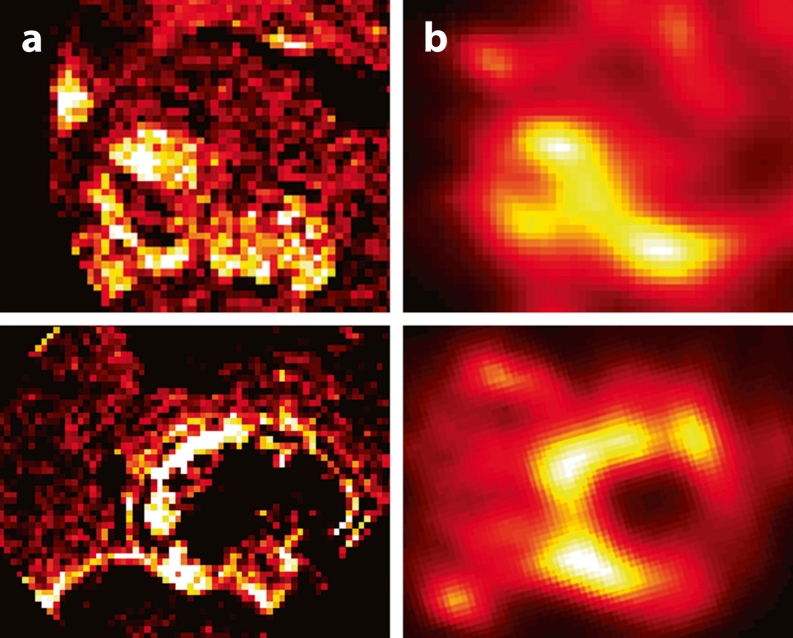
Fig. 5.
Ho-PLLA-MS deposition around tumours. MRI-based concentration maps (a) show more detail (higher resolution) about the distribution of the microspheres than the SPECT-based activity maps. The Ho-PLLA-MS are primarily distributed in the peripheral parts of the tumour (a). This is less pronounced on the SPECT images (b)

