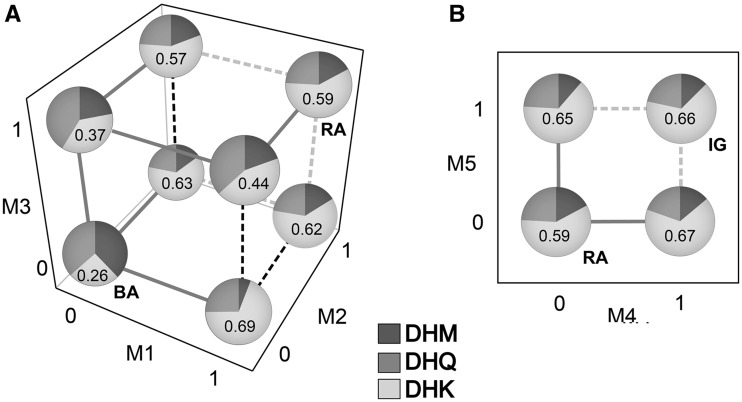
Fig. 3.
Relative activities of DFR on the three substrates for different combinations of mutations. 0 indicates mutation absent, 1 indicates mutation present. (A) Relative activity on DHM, DHQ, and DHK for combinations of mutations M1–M3. (0,0,0) corresponds to Blue Ancestor (BA) sequence and (1,1,1) corresponds to the Red Ancestor (RA) sequence. Moving from (0,0,0) to (1,1,1), solid gray lines indicate a significant increase in relative activity on DHK based on the ANOVA results (supplementary table S4, Supplementary Material online). Dashed black lines indicate a significant decrease in DHK activity, whereas dashed gray lines indicate a nonsignificant change in DHK activity. Each pie graph shows the relative activity for a given DFR sequence on each of the three pigment precursors (DHM, DHQ, and DHK). Values are based on least square means from analyses of variance; the value for relative activity on DHK is given inside each pie chart. (B) Relative activity for combinations of mutations M4 and M5. Interpretation of lines, pie graphs, and values as in (A).

