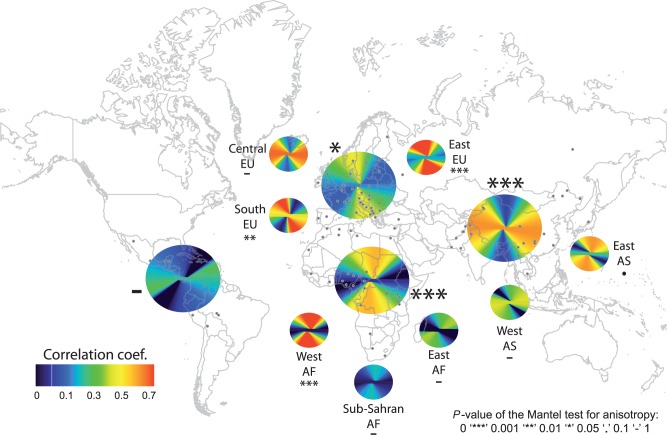
Fig. 3.
Correlation between FST and orientational distances computed along the different bearing lines. Results are shown for the four continents and for several subregions within Africa, Asia, and Europe. The symbols next to each circle indicate the significance of the test for anisotropy. The P values have been obtained using a partial Mantel test in equation (1). The gray dots represent the locations of the sampled populations. The large circles correspond to the continental analyses, whereas the smaller circles correspond to the analyses of regions within continent.

