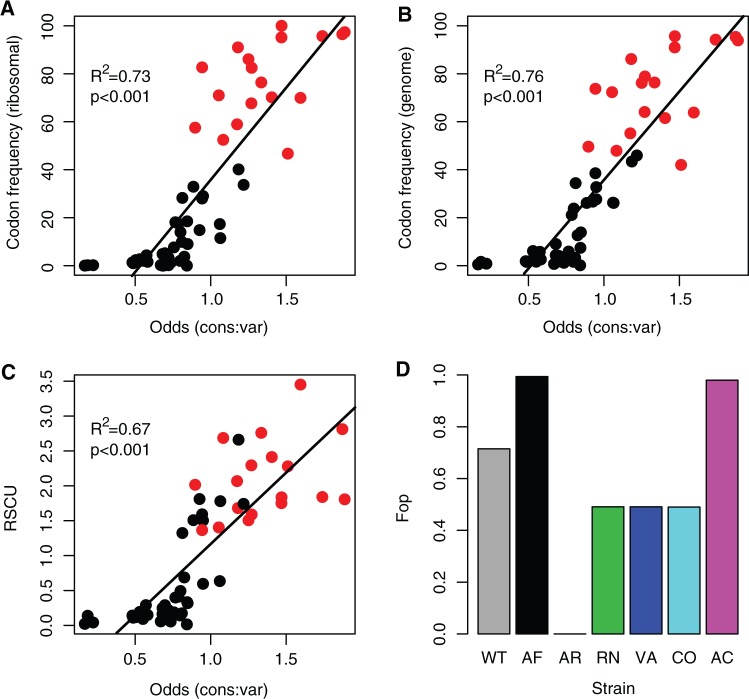
Fig. 1.
Codon usage bias metrics. The relationship between commonly used indices of codon bias and the index of relative codon usage in Methylobacterium extorquens AM1 used in this study (odds ratio of finding a specific codon at conserved rather than variable residues in protein-coding genes across the genome). (A) Relative frequency of codon usage for each amino acid, calculated for a list of 39 highly expressed ribosomal protein coding genes (from the codon usage bias database, http://cub-db.cs.umt.edu/index.shtml, last accessed December 16, 2012). (B) Relative frequency of codon usage for each amino acid, calculated for 1,022 coding regions (GenBank) and (C) relative synonymous codon usage (RSCU), the frequency of each codon normalized by the total number of synonymous codons for that amino acid. (D) The frequency of optimal codons (Fop) for each of the synonymous fae alleles used in this study; bars are colored by strain. In (A–C), red points indicate the most commonly used codon in the respective set of genes. Data in (B) and (C) are based on the entire M. extorquens genome.

