Figure 2.
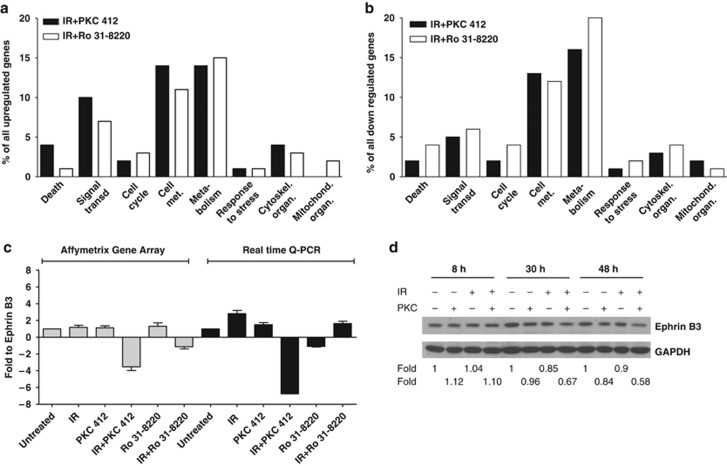
Gene array analysis and gene distribution. (a–b) Gene expression analysis of U-1810 cells treated with IR, PKC 412, or Ro 31–8220 alone, with combinations of IR and PKC 412, or IR and Ro 31–8220 were analyzed after pre-filtering of data using stepwise Venn diagrams. The gene expression analyses were performed at 24 h post IR and with 4h incubation with either PKC 412 or Ro 31–8220. Genes were classified as upregulated relative to control if the expression was above 1.5-fold, or as downregulated if the expression was below 1.5-fold, compared with untreated U-1810 cells. The distribution of regulated genes between the different cellular processes was analyzed using the Gene Spring software. The given values represent the percentage of total altered genes in IR+PKC 412 and IR+Ro 31–8220, respectively. (a) Distribution of upregulated genes in different processes. (b) Distribution of downregulated genes in different processes. (c) Change in Ephrin B3 gene expression in U-1810 cells from Affymetrix gene array analysis was verified using real-time quantitative PCR in response to PKC 412, Ro 31–8220 alone, or in combination with IR (8 Gy). Values are given relative to untreated U-1810 cells. Data are representatives from three independent experiments. Gray bars: Affymetrix gene expression array; Black bars: real-time quantitative PCR. (d) Western blot analysis of Ephrin B3 expression was performed 8, 30 and 48 h post IR and GAPDH was used as a loading control

