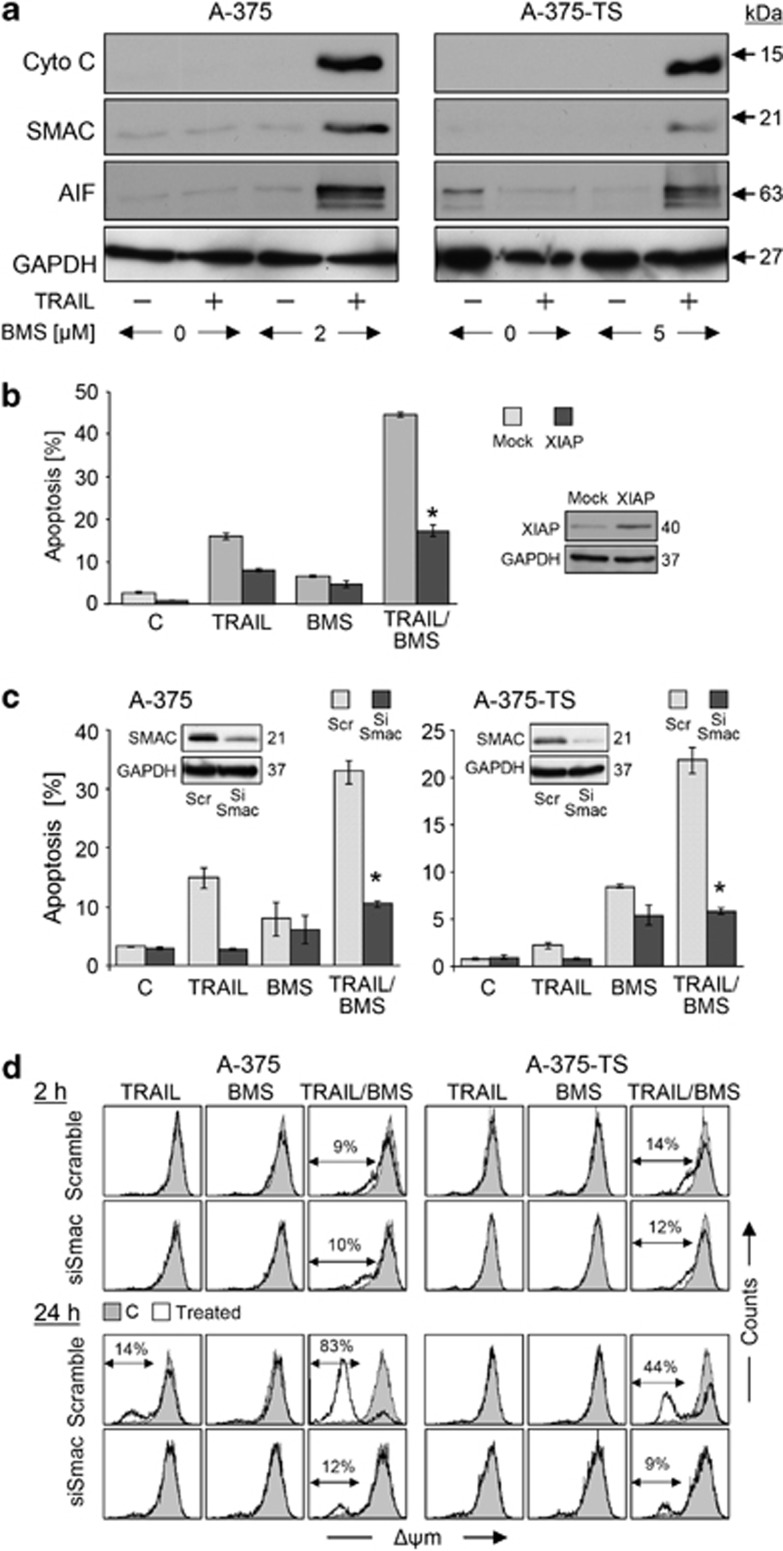
Figure 5.
Roles of mitochondrial apoptosis pathways and Smac. (a) Cytosolic extracts of A-375 and A-375-TS treated for 2 h with TRAIL±BMS-345541 (A-375, 2 μM; A-375-TS, 5 μM) were investigated by western blotting. Equal loading was proven by the cytosolic protein GAPDH. Two independent experiments revealed highly comparable results. (b) The sensitivity of A-375 for BMS-345541/TRAIL-induced apoptosis (2 μM/20 μM) was monitored after transfection of a XIAP-encoding plasmid. Mock-transfected cells are shown as controls. Apoptosis (% of sub-G1 cells) is shown at 24 h of treatment. Mean values and S.D.'s of a representative experiment (one of two) is shown; each experiment consisted of triplicates. Statistical significance is indicated (*P<0.05), when comparing to mock controls. XIAP expression is shown in an inset. (c) Sensitivity of A-375 and A-375-TS cells for BMS-345541/TRAIL-induced apoptosis (sub-G1 cells, 24 h treatment) is shown after siRNA-mediated Smac knockdown (dark bars), as compared to respective scramble-siRNA-transfected controls (gray). Smac downregulation is shown in insets (western blotting, GAPDH as control). Mean values and S.D.'s of two independent experiments with triplicates are shown; statistical significance is indicated (*P<0.05), comparing apoptosis after transfection with siRNA against Smac and scramble siRNA. (d) Δψm was determined in A-375 and A-375-TS cells treated for 2 h or 24 h with TRAIL (20 ng/ml)±BMS-345541 (A-375, 2 μM; A-375-TS, 5 μM). Treated cells (open graphs) were compared with DMSO-treated controls (gray). Two independent experiments with triplicates showed highly comparable results

