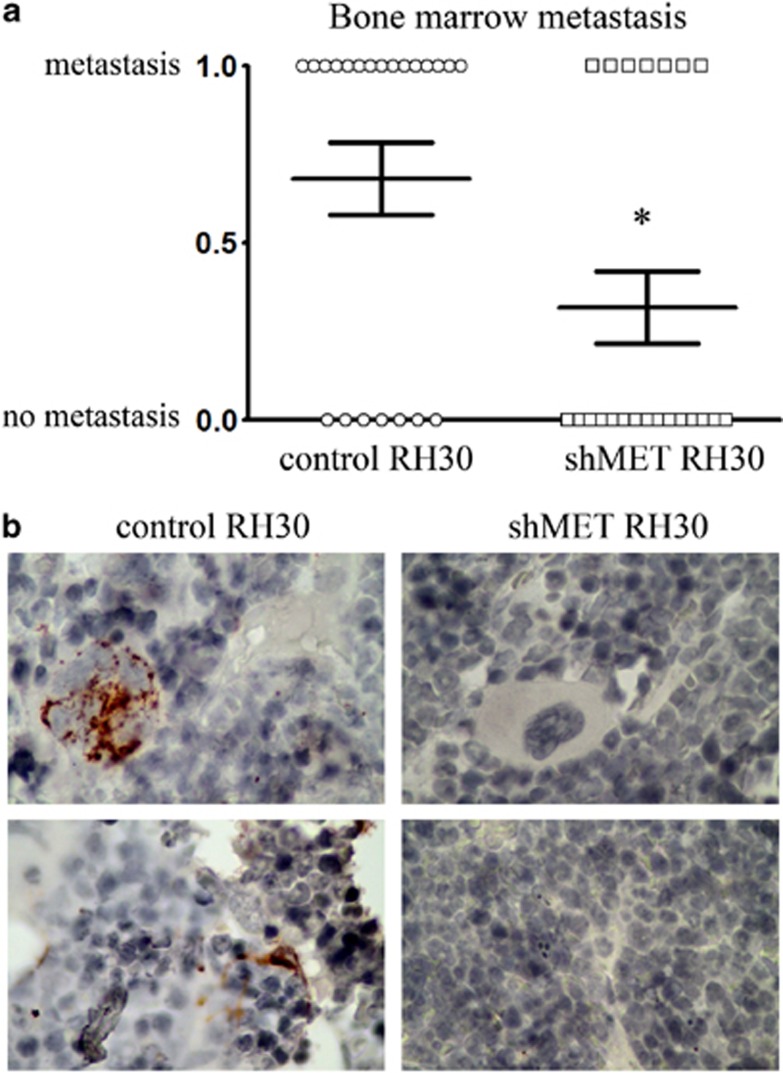
Figure 2.
BM metastatic ability of tumors derived from control and shMET cells. (a) The graph shows the percentage of legs with and without metastasis in the BM for control RH30 and shMET RH30 cells. Each point on the graph represents one leg (WT–circle, shMET-square). These experiments were performed twice with n=6 and n=5, giving the overall number of 22 legs for each group. The results were combined and submitted to χ2 analysis. χ2, df=4.464. *P<0.05. (b) Immunohistochemistry of murine BM. Human RMS cells are visualized using anti-vimentin staining. 600 × magnification

