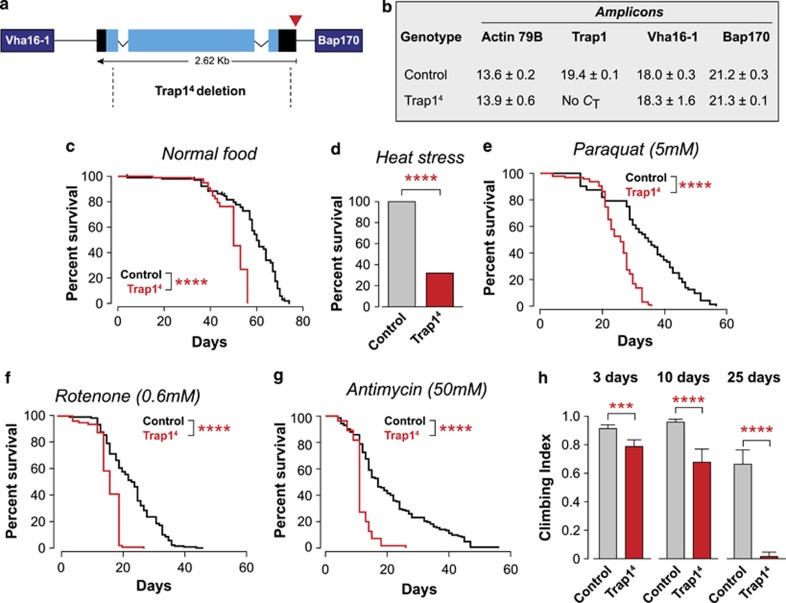
Figure 1.
The loss of Trap1 in Drosophila causes motor impairment and an increased sensitivity to stress. (a) Genomic map of Trap1 (cytological location 42B2). Black, untranslated regions; light blue, exons. The P-element insertion (EY10238) is indicated by the red triangle. The neighbouring genes (Vha16-1 and Bap170) are indicated in dark blue. Trap14 deletion, delimited by the dashed lines, removes most of the Trap1 gene. (b) Analysis of the expression levels of Trap1 and its neighbouring genes. Expression levels were measured by real-time PCR in 3-day-old flies with the indicated genotypes (mean Ct±S.D., n=4 per genotype). Expression of actin was used as a control. No Ct for the Trap1 transcript was detected in Trap14 mutants. (c) Trap14 mutants (red) have a reduced lifespan compared with the controls (black). Fly viability was scored over a period of 75 days, using a minimum of 100 flies per genotype. The statistical significance is indicated (log-rank, Mantel–Cox test). (d–g) Trap1 mutant flies show enhanced sensitivity to stress. (d) Flies were subjected to heat stress, and viability was assessed after 24 h. A total of 100 males (4 days old) were assayed for each genotype. The asterisks indicate significant values (Fisher's exact test, two-sided, alpha<0.05). (e–g) Flies were maintained on food supplemented with the indicated drugs, and the viability was scored over a period of 60 days, using a minimum of 100 flies per genotype. The statistical significance is indicated by the asterisks (log-rank, Mantel–Cox test). (h) Trap14 mutants show a decrease in motor performance. Flies with the indicated genotypes and ages were tested using a standard climbing assay (mean±S.D., n≥80 flies for each genotype). The asterisks indicate significant values (two-way ANOVA with the Bonferroni multiple comparison test)

