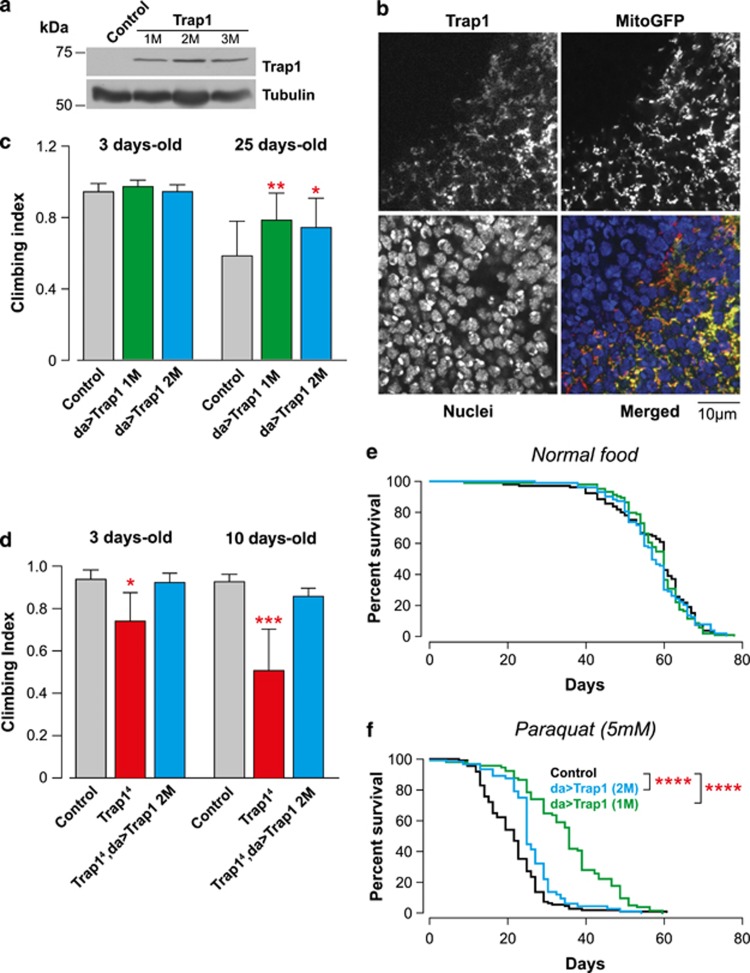
Figure 3.
Expression of Drosophila Trap1 confers resistance to stress. (a) Analysis of the Trap1 expression levels in transgenic flies. Whole-fly lysates were analysed by western blotting with the indicated antibodies. (b) Trap1 localises to the mitochondria. Confocal analysis of the posterior compartment of larval wing discs coexpressing Trap1 and a mitoGFP under the control of the enGAL4 driver. In the merged colour image, red corresponds to Trap1, blue to nuclei and green to mitoGFP. (c) The expression of Trap1 results in increased motor performance. Flies with the indicated genotypes and ages were tested using a standard climbing assay (mean±S.D., n≥120 flies for each genotype). The asterisks indicate significant values relative to the control (two-way ANOVA with the Bonferroni multiple comparison test). (d) The expression of Trap1 reversed the decrease in motor performance in Trap14 mutants. Flies with the indicated genotypes and ages were tested using a standard climbing assay (mean±S.D., n≥80 flies for each genotype). The asterisks indicate significant values relative to the control (two-way ANOVA with the Bonferroni multiple comparison test). (e) Trap1 expression does not affect the total lifespan. A total of 100 flies per genotype were maintained on normal food for a period of 80 days. (f) Trap1-expressing flies (green and blue) show enhanced resistance to paraquat toxicity compared with the controls (black). Fly viability was scored over a period of 60 days using a minimum of 100 flies per genotype. The statistical significance is indicated by the asterisks (log-rank, Mantel–Cox test)

