Figure 1.
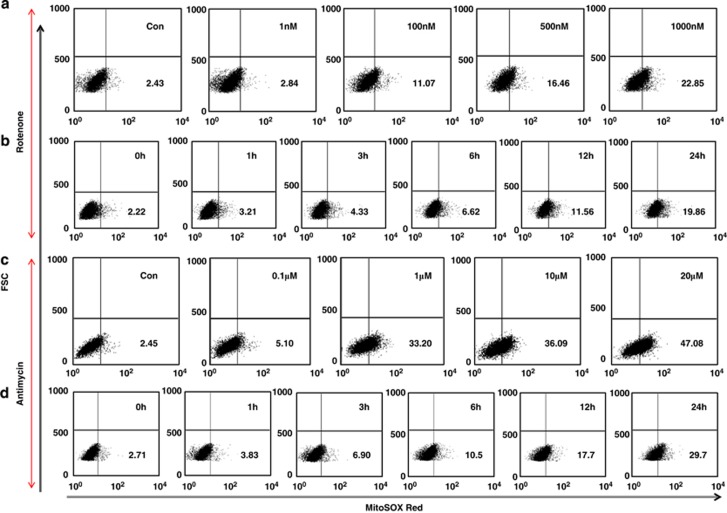
Increased mitochondrial ROS generation with mitochondrial inhibitors. ROS measurement in BEAS-2B cells with different concentrations of rotenone as indicated (a). All measurements were at 12 h post rotenone. (b) Time dependent increase in ROS generation by mitochondria, by inducing cells with a sublethal rotenone concentration (100 nℳ). Similar Results were obtained with antimycin, which was used at different concentrations as indicated on box plots (c) and a suboptimal concentration (0.1 μℳ) was used for time kinetic experiments (d). MitoSOX Red fluorescence is shown on X-axis, and cell size on Y-axis (FSC)

