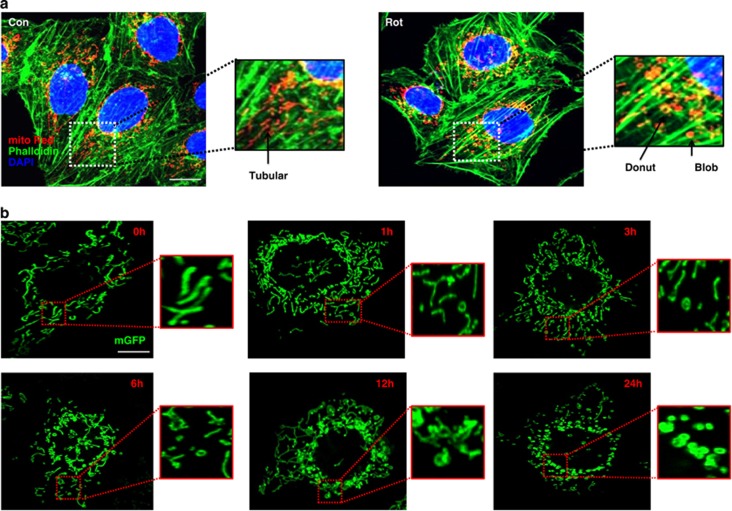
Figure 2.
Mitochondrial shape change with Stress. (a) Tubular mitochondrial shapes are seen in control (Con) cells, with other shapes (Donut/Blob) emerging after rotenone (Rot) treatment. A magnified portion of control or rotenone treated cell showing all the three shapes (a). (b) Time-dependent change in mitochondrial shape after rotenone treatment, with time points as indicated on figures, magnified portions of the images show a clear shape change in mitochondria with time. BEAS-2B cells were transfected with mGFP and imaged at the indicated time points. Scale bars; 10 μm

