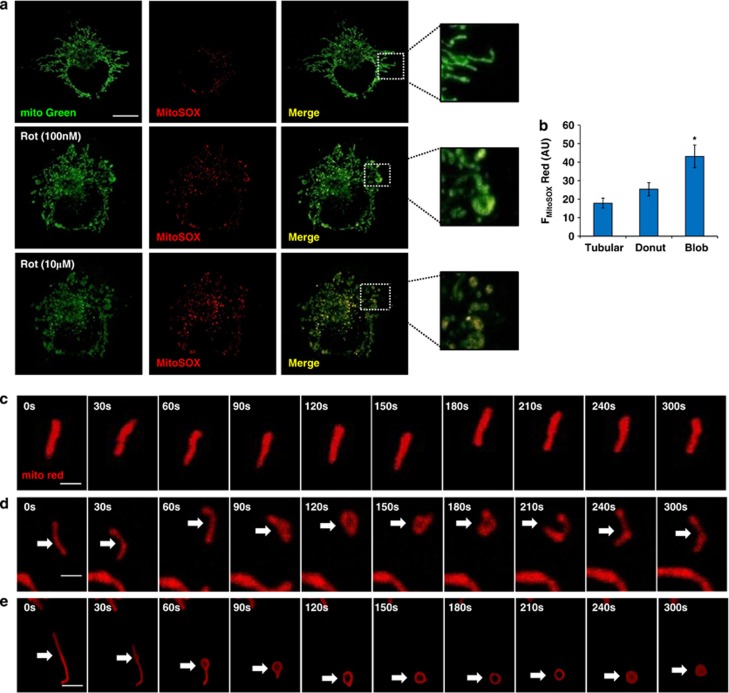
Figure 3.
Blob shaped mitochondria has increased mtROS and is an irreversible form. Blob/Donut from was associated with increased mtROS generation as revealed by live cell imaging (a). Images are shown for each color and merged for control and rotenone (100 nℳ for 12 h) pretreated cells at 0 s and 300 s after induction with further 10 μℳ of rotenone. Yellow color denotes mitochondria that are actively producing mtROS. (b) Spatial differences in mtROS quantified for different shapes of mitochondria and represented as total flourescent intensity of MitoSOX Red (FMitoSOX Red) in arbitrary units (AU). Blob shaped mitochondria were the predominant source of mtROS (b). Time lapse images of a single mitochondrion under control (c, d) and rotenone treated conditions (e), with shape change from Tubular to Blob via Donut form (e). Mitochondria are labeled with Mitotracker Green (mito Green) and mtROS (MitoSOX Red, red) (a) and with mitotracker red (c–e). Data is the representative of three different experiments with at least 10 images used for quantitation. Scale bars; 10 μm (a) and 5 μm (c–e). *denotes P<0.05 versus Tubular form

