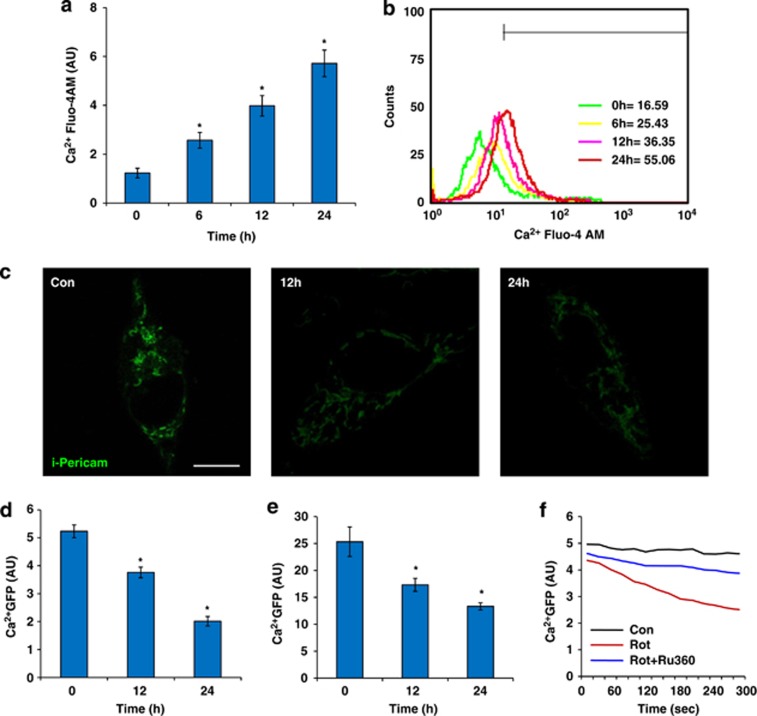
Figure 5.
Calcium-dependent changes in mitochondrial shape. Calcium was measured in rotenone induced BEAS-2B cells with calcium sensitive dye (Fluo-4AM) at various time points, with mean cellular intensity, as quantified from the confocal images (a) and fluorescence quantitation using flow cytometry (b). Mitochondrial calcium imaging as done by i-pericam (green), in control and rotenone induced conditions (c), with mean GFP calcium intensity (d). (e) FACS based measurement of mean calcium intensity at different time points with rotenone treatment. (f) Ruthenium-360 (Ru360), a mitochondrial calcium uniporter inhibitor, inhibits mitochondrial calcium entry, measured by FACS over 300 s after 10 μM rotenone. Scale bars; 25 μm. *denotes P<0.05 versus 0 hour (h) time point

