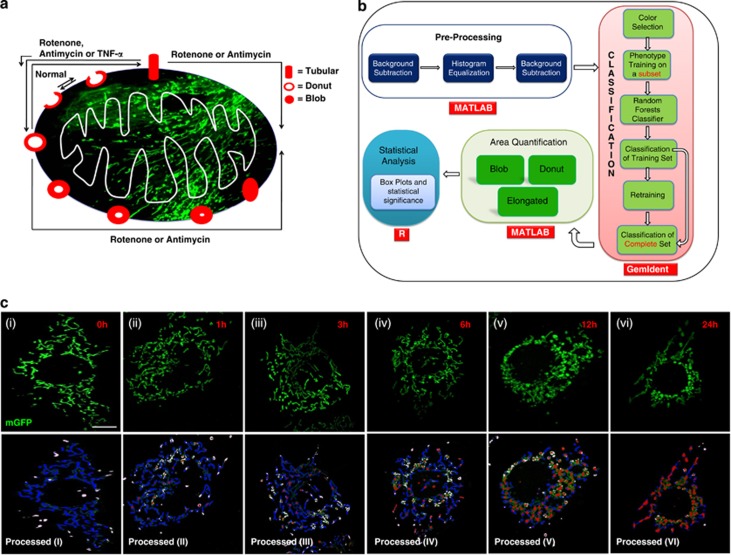
Figure 6.
Shape recognition pipeline for automated classification of different mitochondrial shapes. Graphical representation of mitochondrial shape change during stresses (a). A schematic overview of the pipeline (b). Recognition of different shapes of mitochondria by the software (c) at different time points as indicated on figures. Mitochondria were labeled with mGFP (true color) and the software processed images were pseudo colored as, blue=Tubular, white=Donut, red=Blob and green=not classifiable. Mitochondria were in Tubular form under normal conditions (cI,) with a time-dependent trend towards blob or donut form under stress conditions (cII to cVI). More than 15 images were used for quantitation. Scale bars; 10 μm

