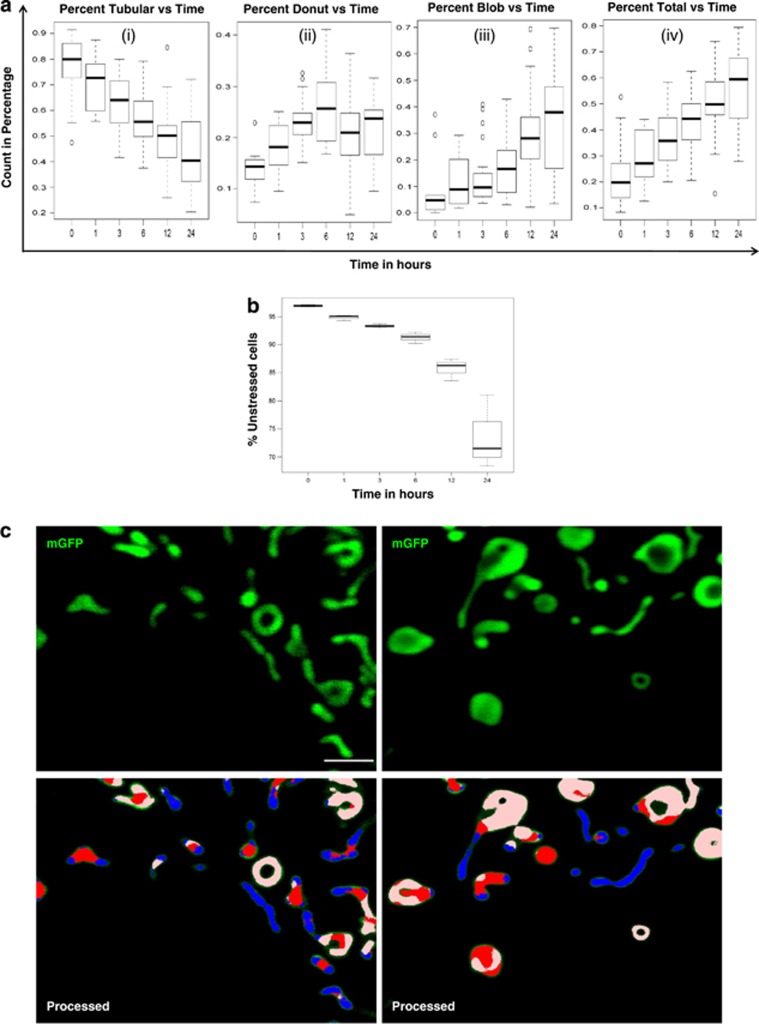
Figure 7.
High-throughput automated mitochondrial shape quantification. Mitochondrial shape quantification done by the software shows the correlation of different shapes of mitochondria with time after rotenone treatment. (a) Percentage of mitochondria classified as belong to a particular shape, as a function of time after rotenone treatment. Tubular forms diminish with time, with donut shapes rising within 1 h and blobs increasing at late time (6 h onwards). Total refers to the sum of donut and blobs. The increase in blob mitochondrial shapes (a) inversely match the fraction of un-stressed cells (cells with low mtROS levels determined by FACS) (b). (c) High resolution confocal images to clearly visualize all three forms of mitochondria. Software could reliably distinguish between all the three forms of mitochondria, blue=Tubular, white=Donut, red=Blob and green=not detected. At least 15 images were used for quantitation. Scale bars; 5 μm

