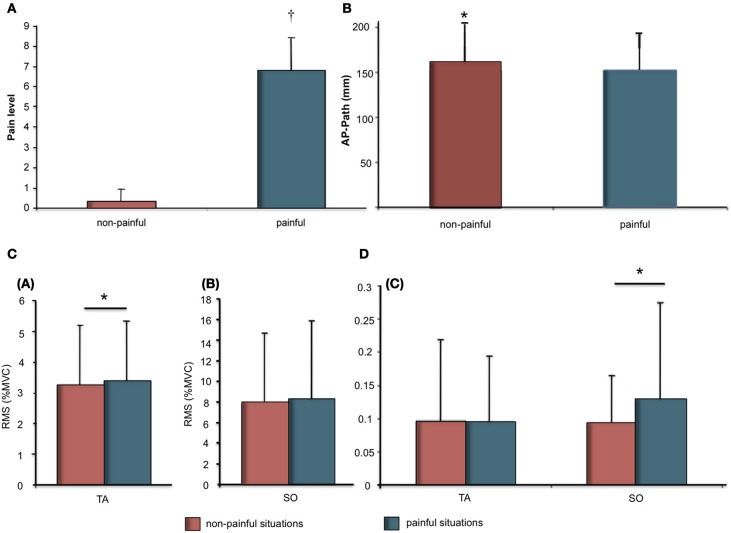
Figure 1.
(A) Pain ratings (Mean and SD) as a function of stimuli (Painful vs. Non-painful). Significant differences are indicated as: †p < 0.001; (B) Means and SDs of the anteroposterior length as a function of stimuli (painful vs. non-painful); (C) Means and SDs of electromyographic data for Soleus (SO) and Tibialis Anterior (TA) muscles. (a) RMS as % of MVC for TA as a function of stimuli (painful vs. non-painful). (b) RMS as % of MVC for SO as a function of stimuli (painful vs. non-painful); (D) (c) Variability of RMS as a function of stimuli (painful vs. non-painful). Significant differences are indicated as: * p < 0.05.

