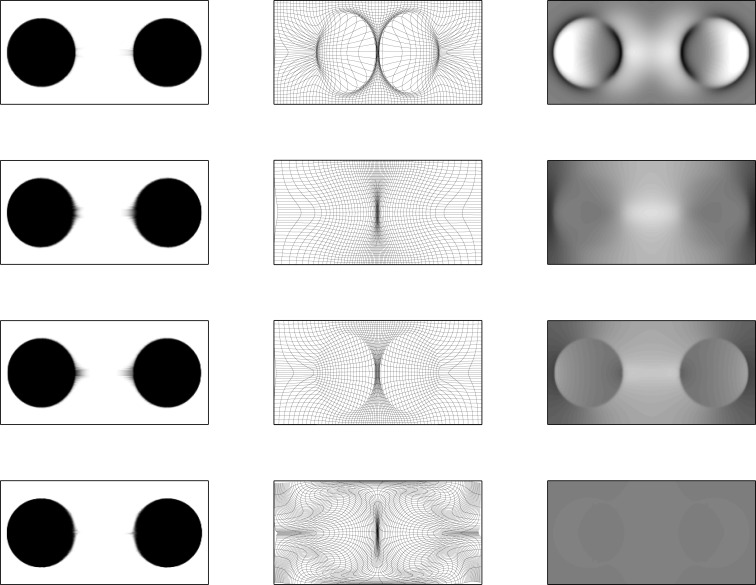
Figure 5.
Warped simulated images. First column: lower image warped to match upper image. Second column: deformation fields. Third column: logarithms of Jacobian determinants (color-scales are the same for all examples, and in the range of −3 to 3). First row: results from ω1 = 0.001, ω2 = 0.001, and ω3 = 0.1, with an additional penalty on the square of absolute displacements of 0.0001. Second row: results from ω1 = 0.001, ω2 = 0.001, and ω3 = 2.0. Third row: results from ω1 = 0.05, ω2 = 0.0001, and ω3 = 0.0001. Fourth row: results from ω1 = 0.001, ω2 = 0.5, and ω3 = 0.001.

