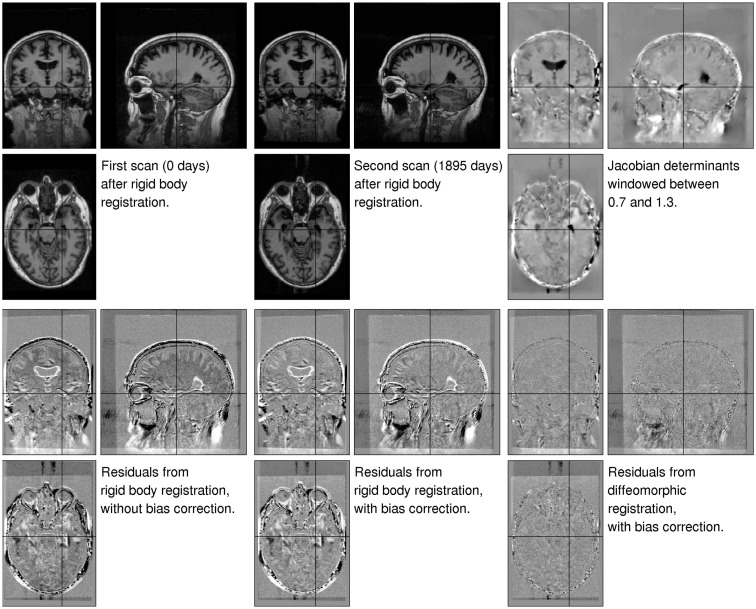
Figure 6.
Illustration of the results obtained from matching a pair of images of a subject with mild cognitive impairment, which were collected 1895 days apart (OAS2_0002). The three images of the residual difference shown along the bottom are all windowed the same. Black indicates a value of −500 or less, whereas white indicates values of 500 or above.

