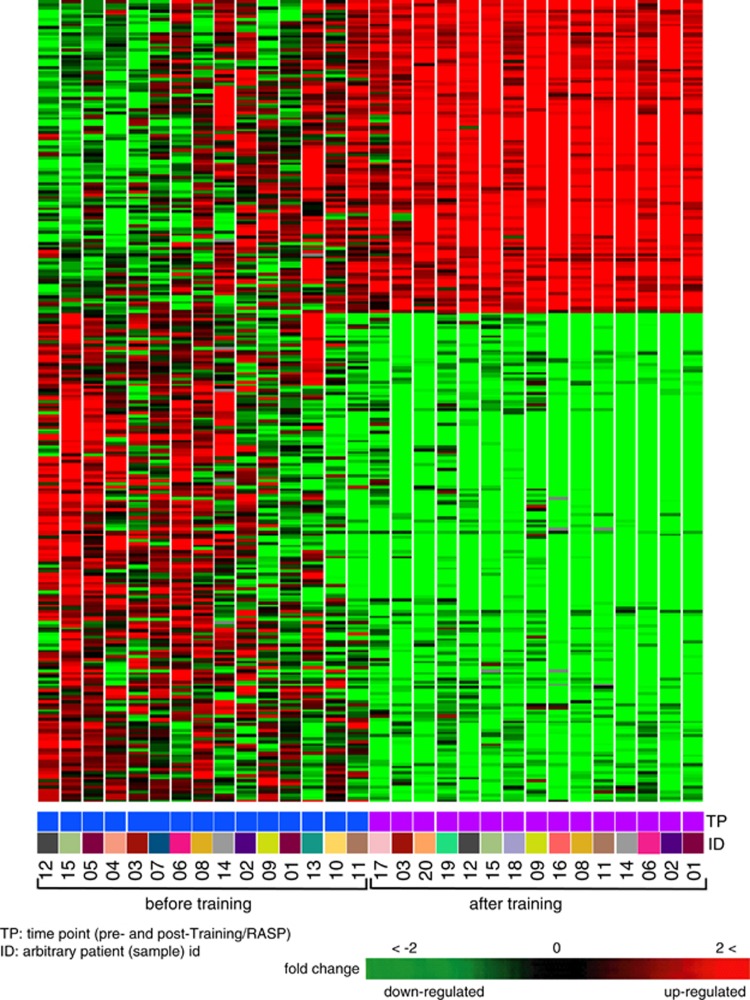
Figure 2.
Heat map of differentially expressed genes in leukocytes of soldiers before and after RASP. Heat map shows hierarchical clustering of 288 genes that passed Welch's t-test with FDR correction (q<0.001) and had expression alteration of ⩾1.5-fold. Each lane shows the 288 genes and their leukocyte expression level for each subject before (left panel) or after (right panel) RASP in comparison to human universal reference RNA.

